⚠️
Experimental tool — not a forecast product
This atlas compares raw forecast-model output across different lead times, interpolation
methods, and probability metrics. It is a model-comparison and QA visualization, not a
validated forecast product: nothing shown here has been checked against observed outcomes.
Treat it as a look at how the models behave, not a prediction of what will happen.
How to Read This Atlas
What this atlas shows
This page compares how different weather models forecast precipitation for the same
four locations, side by side. It is a model-comparison and quality-check tool built for
watching model behavior over time — not a precipitation forecast in its own right.
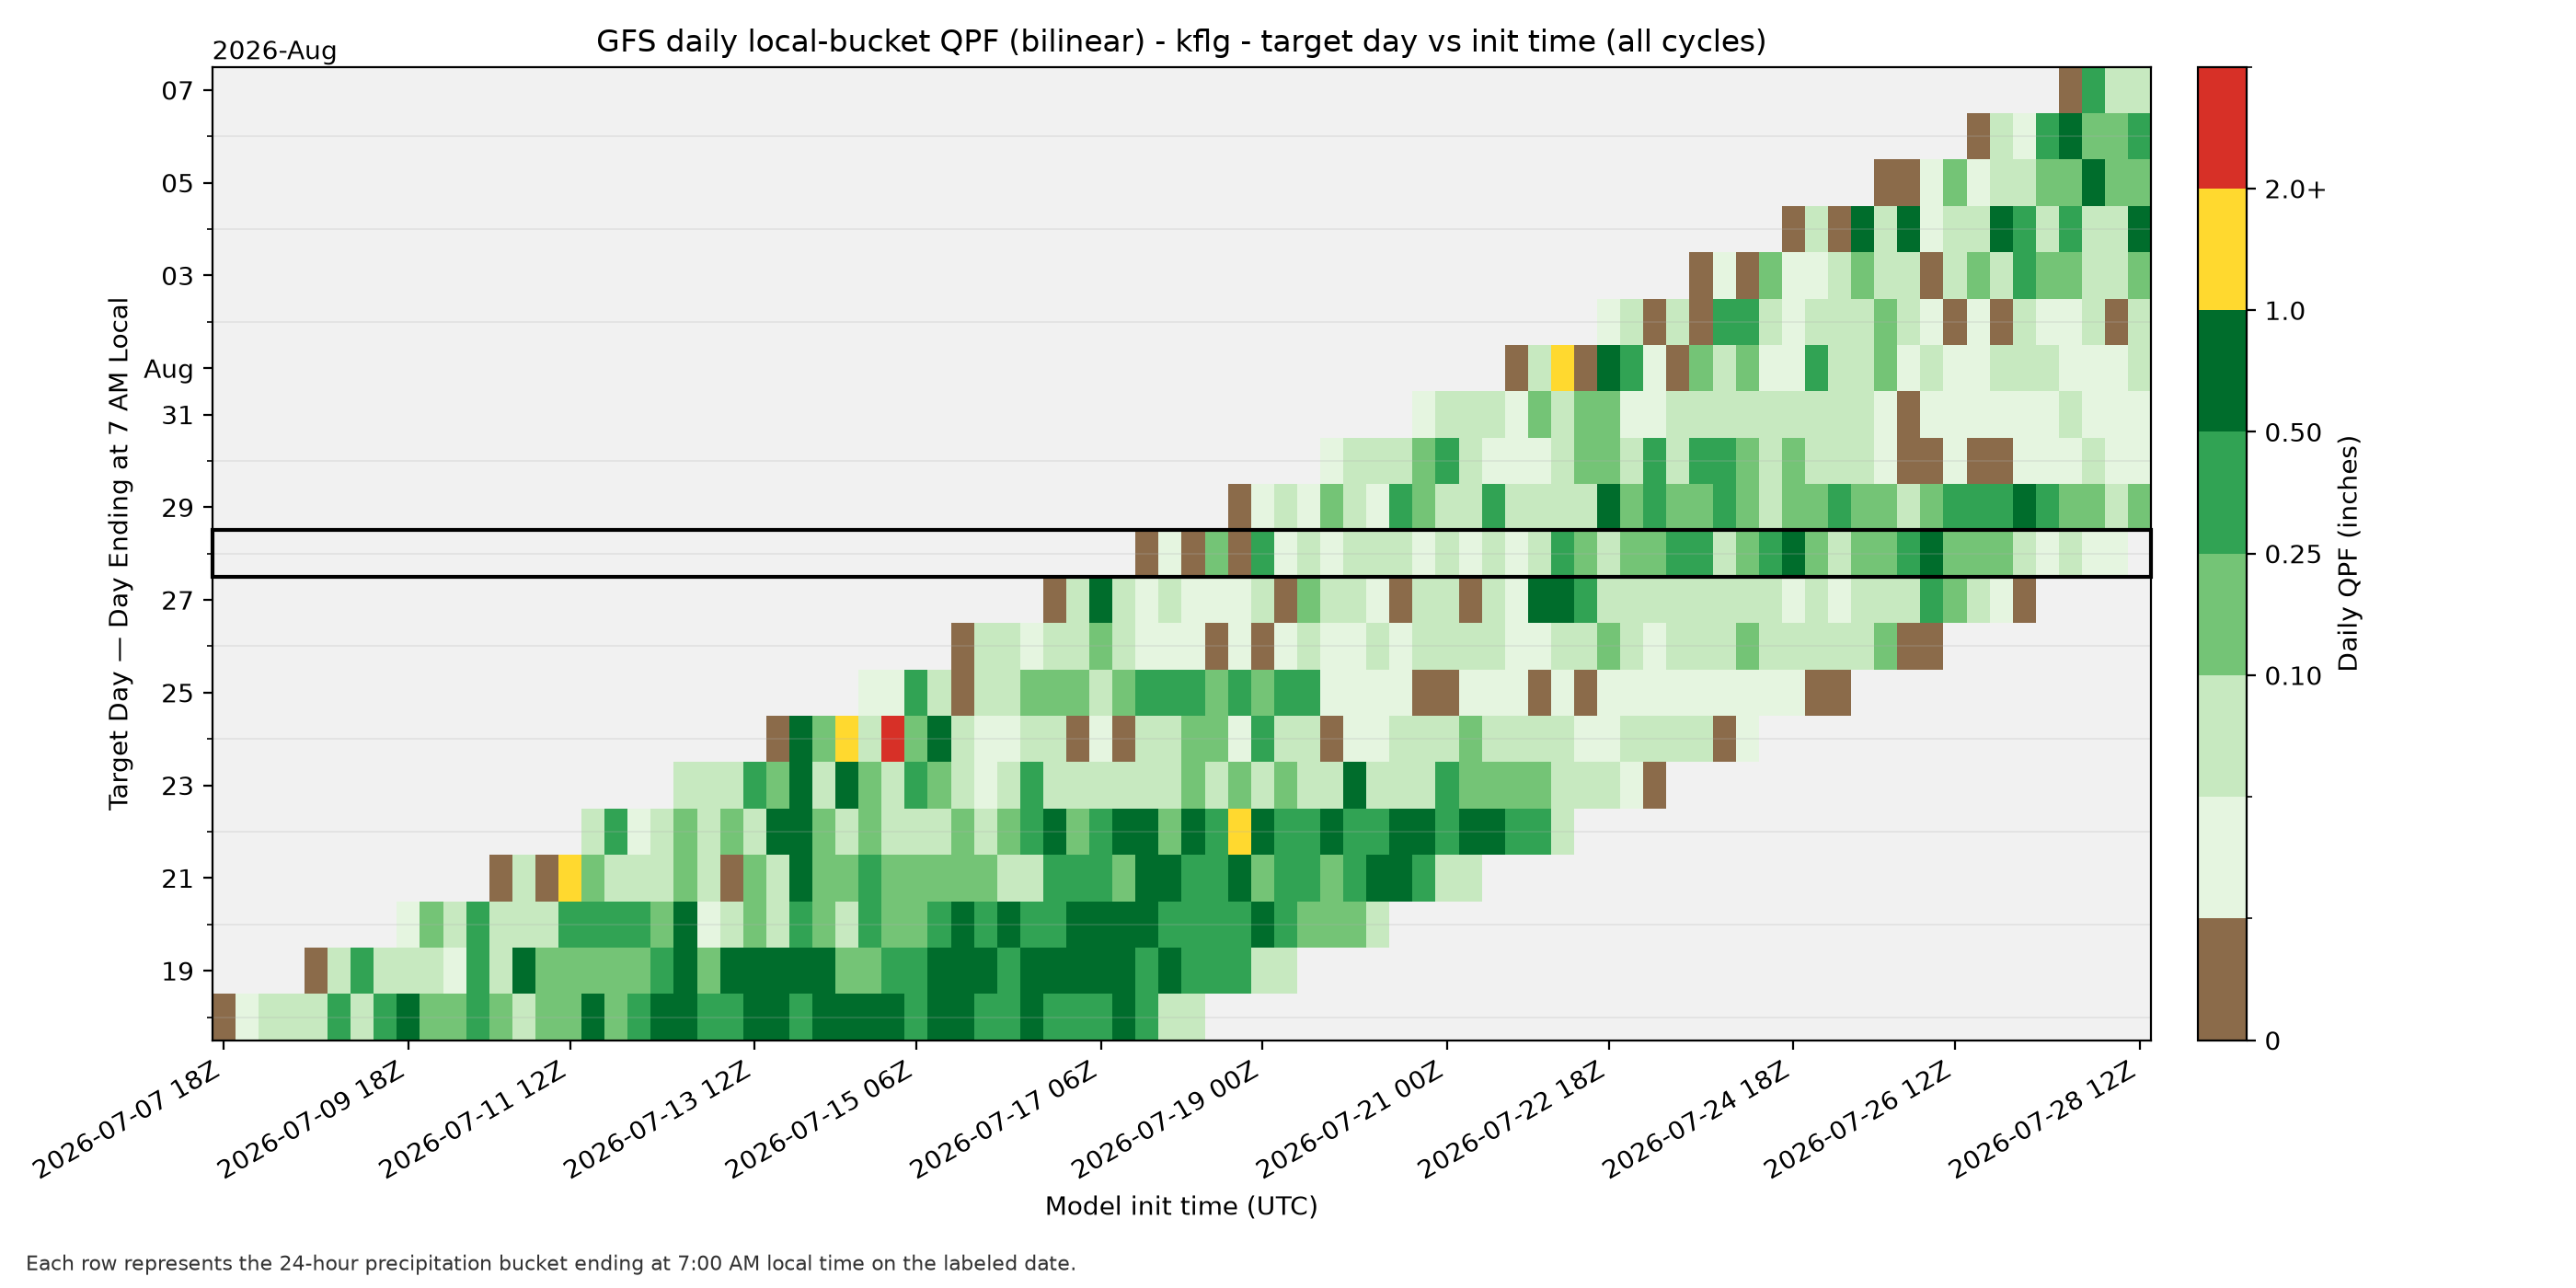
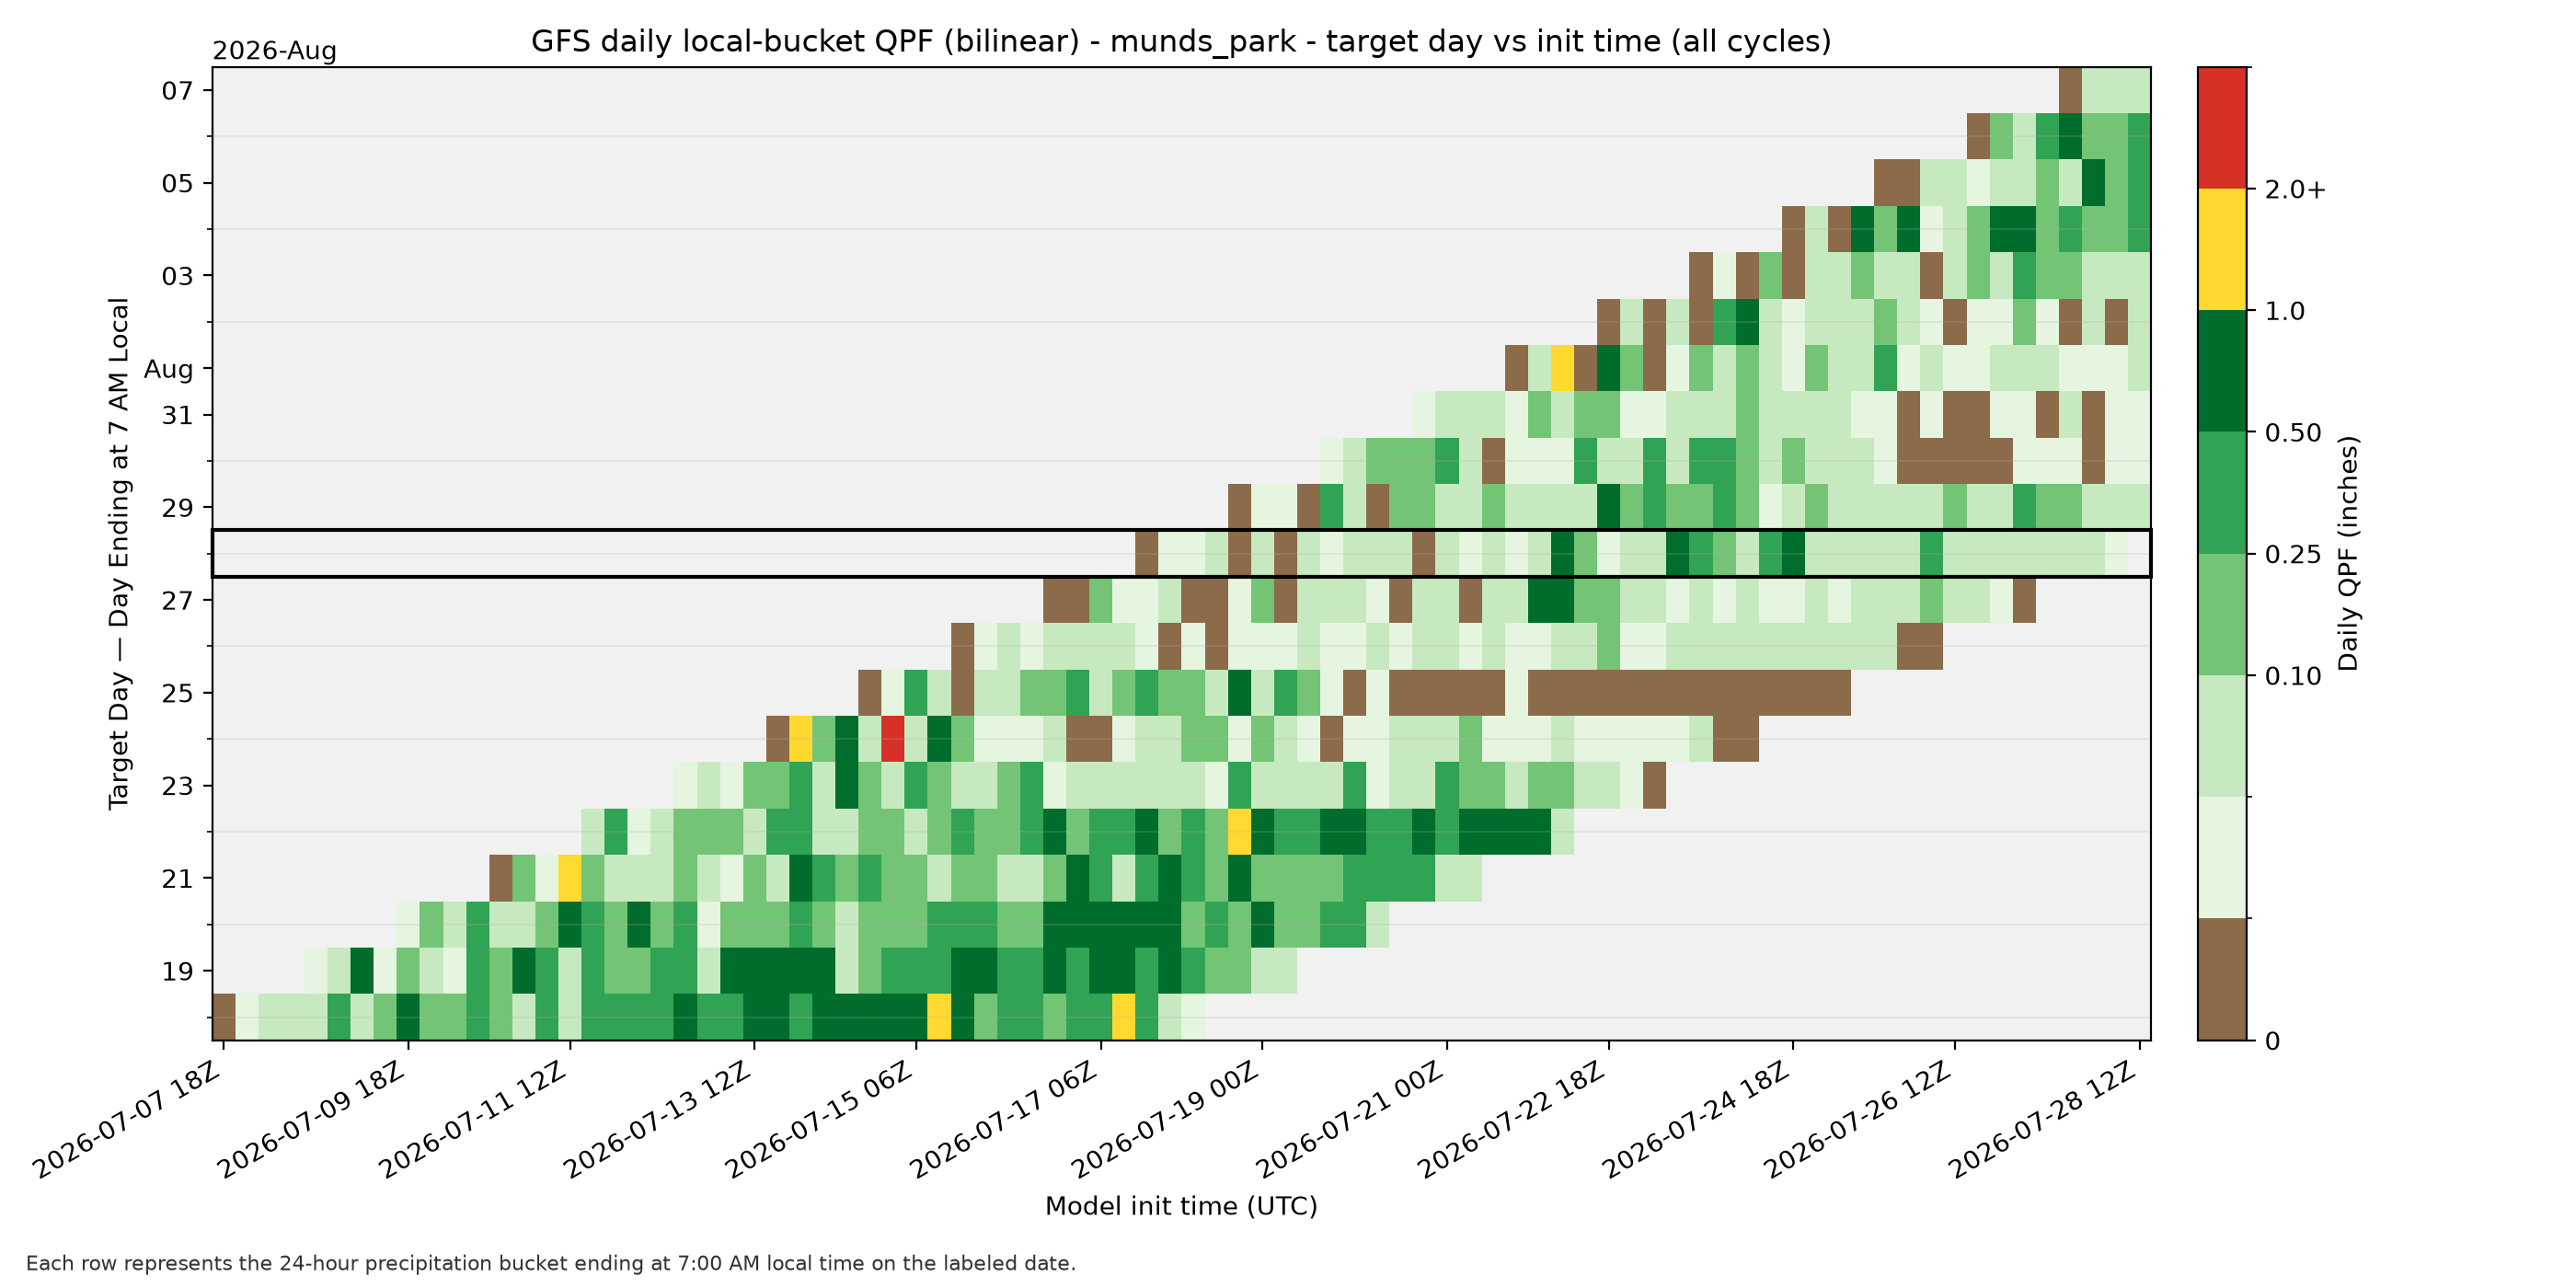
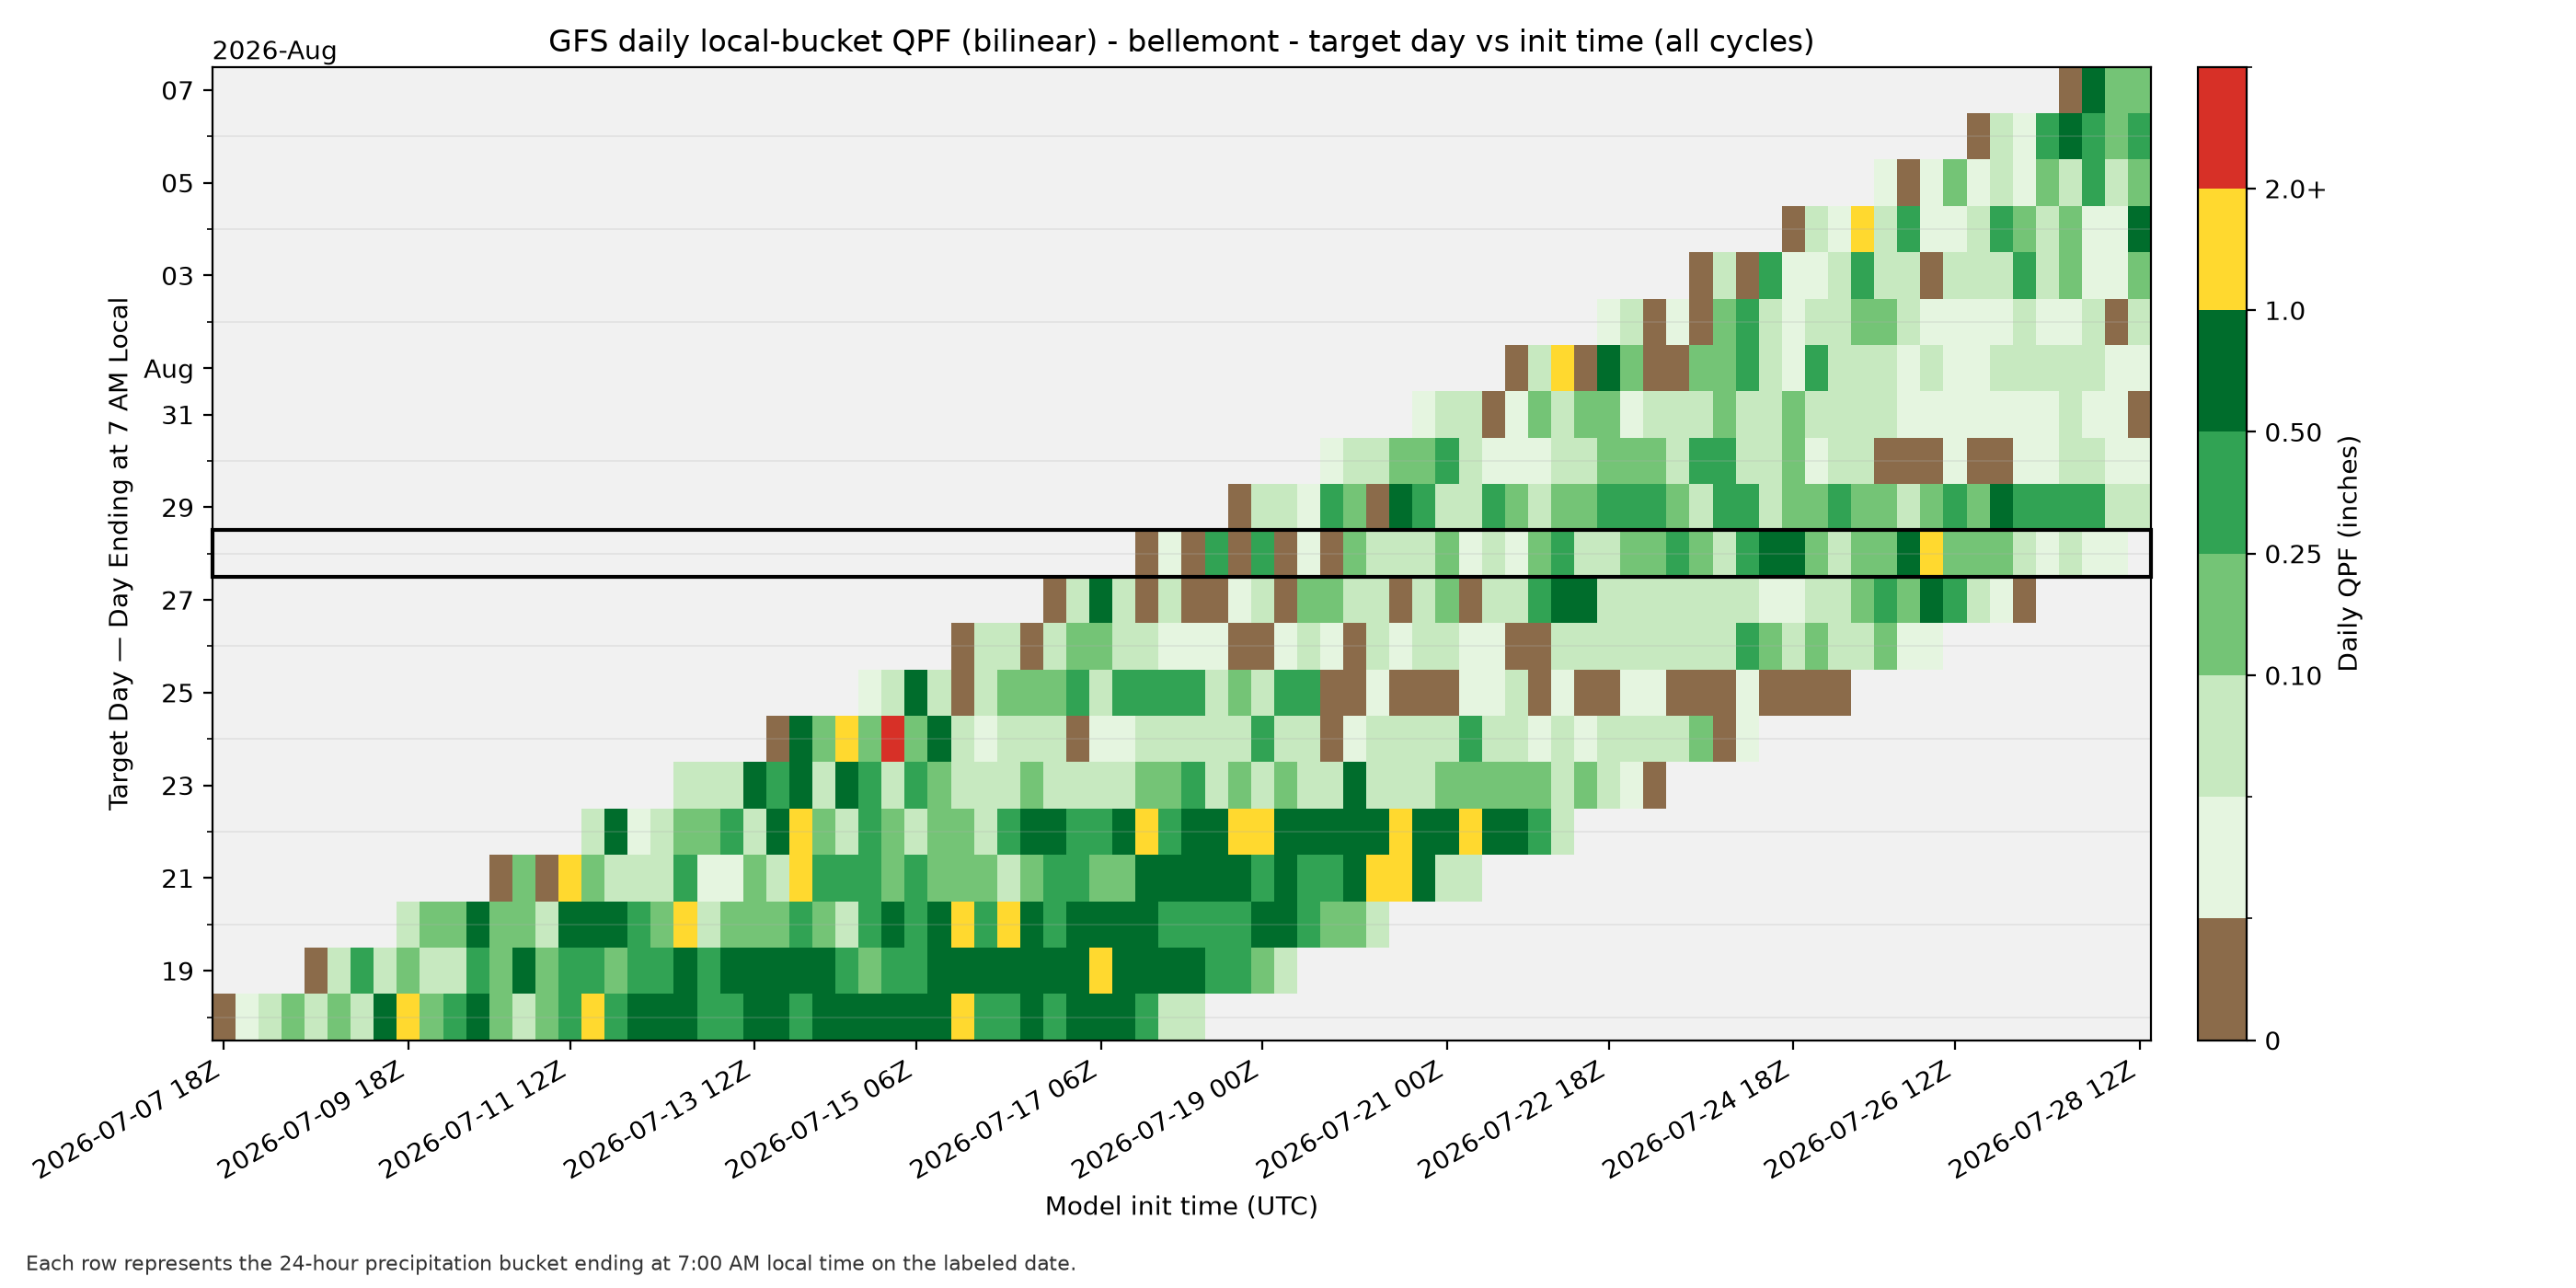
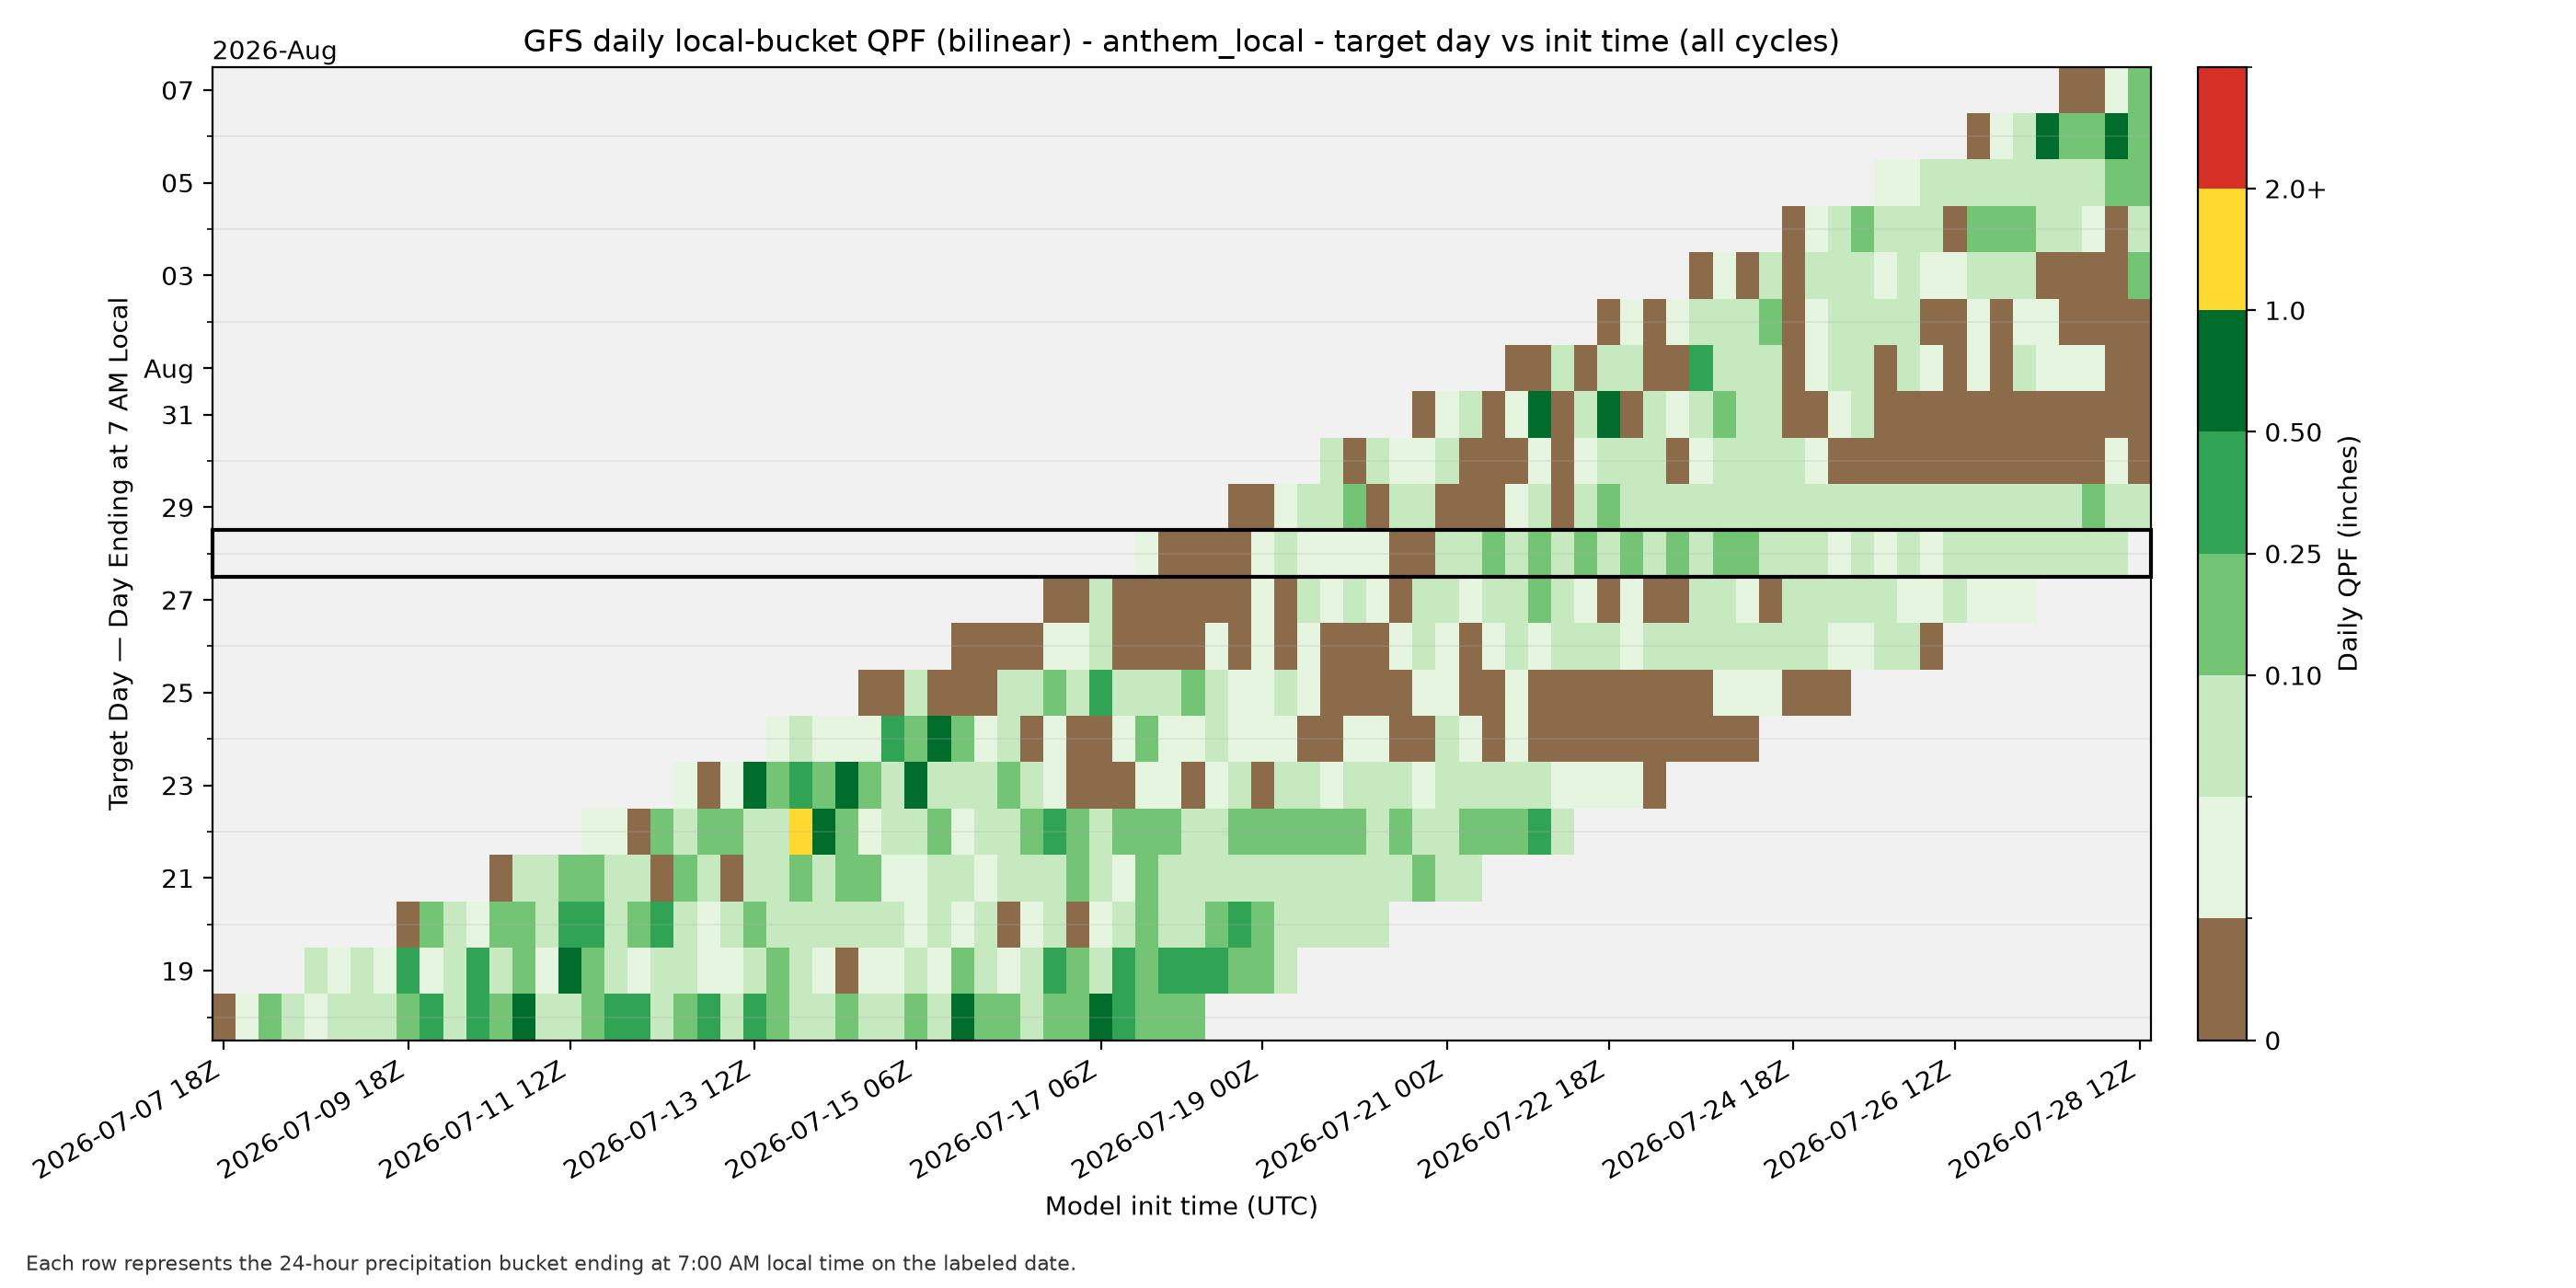
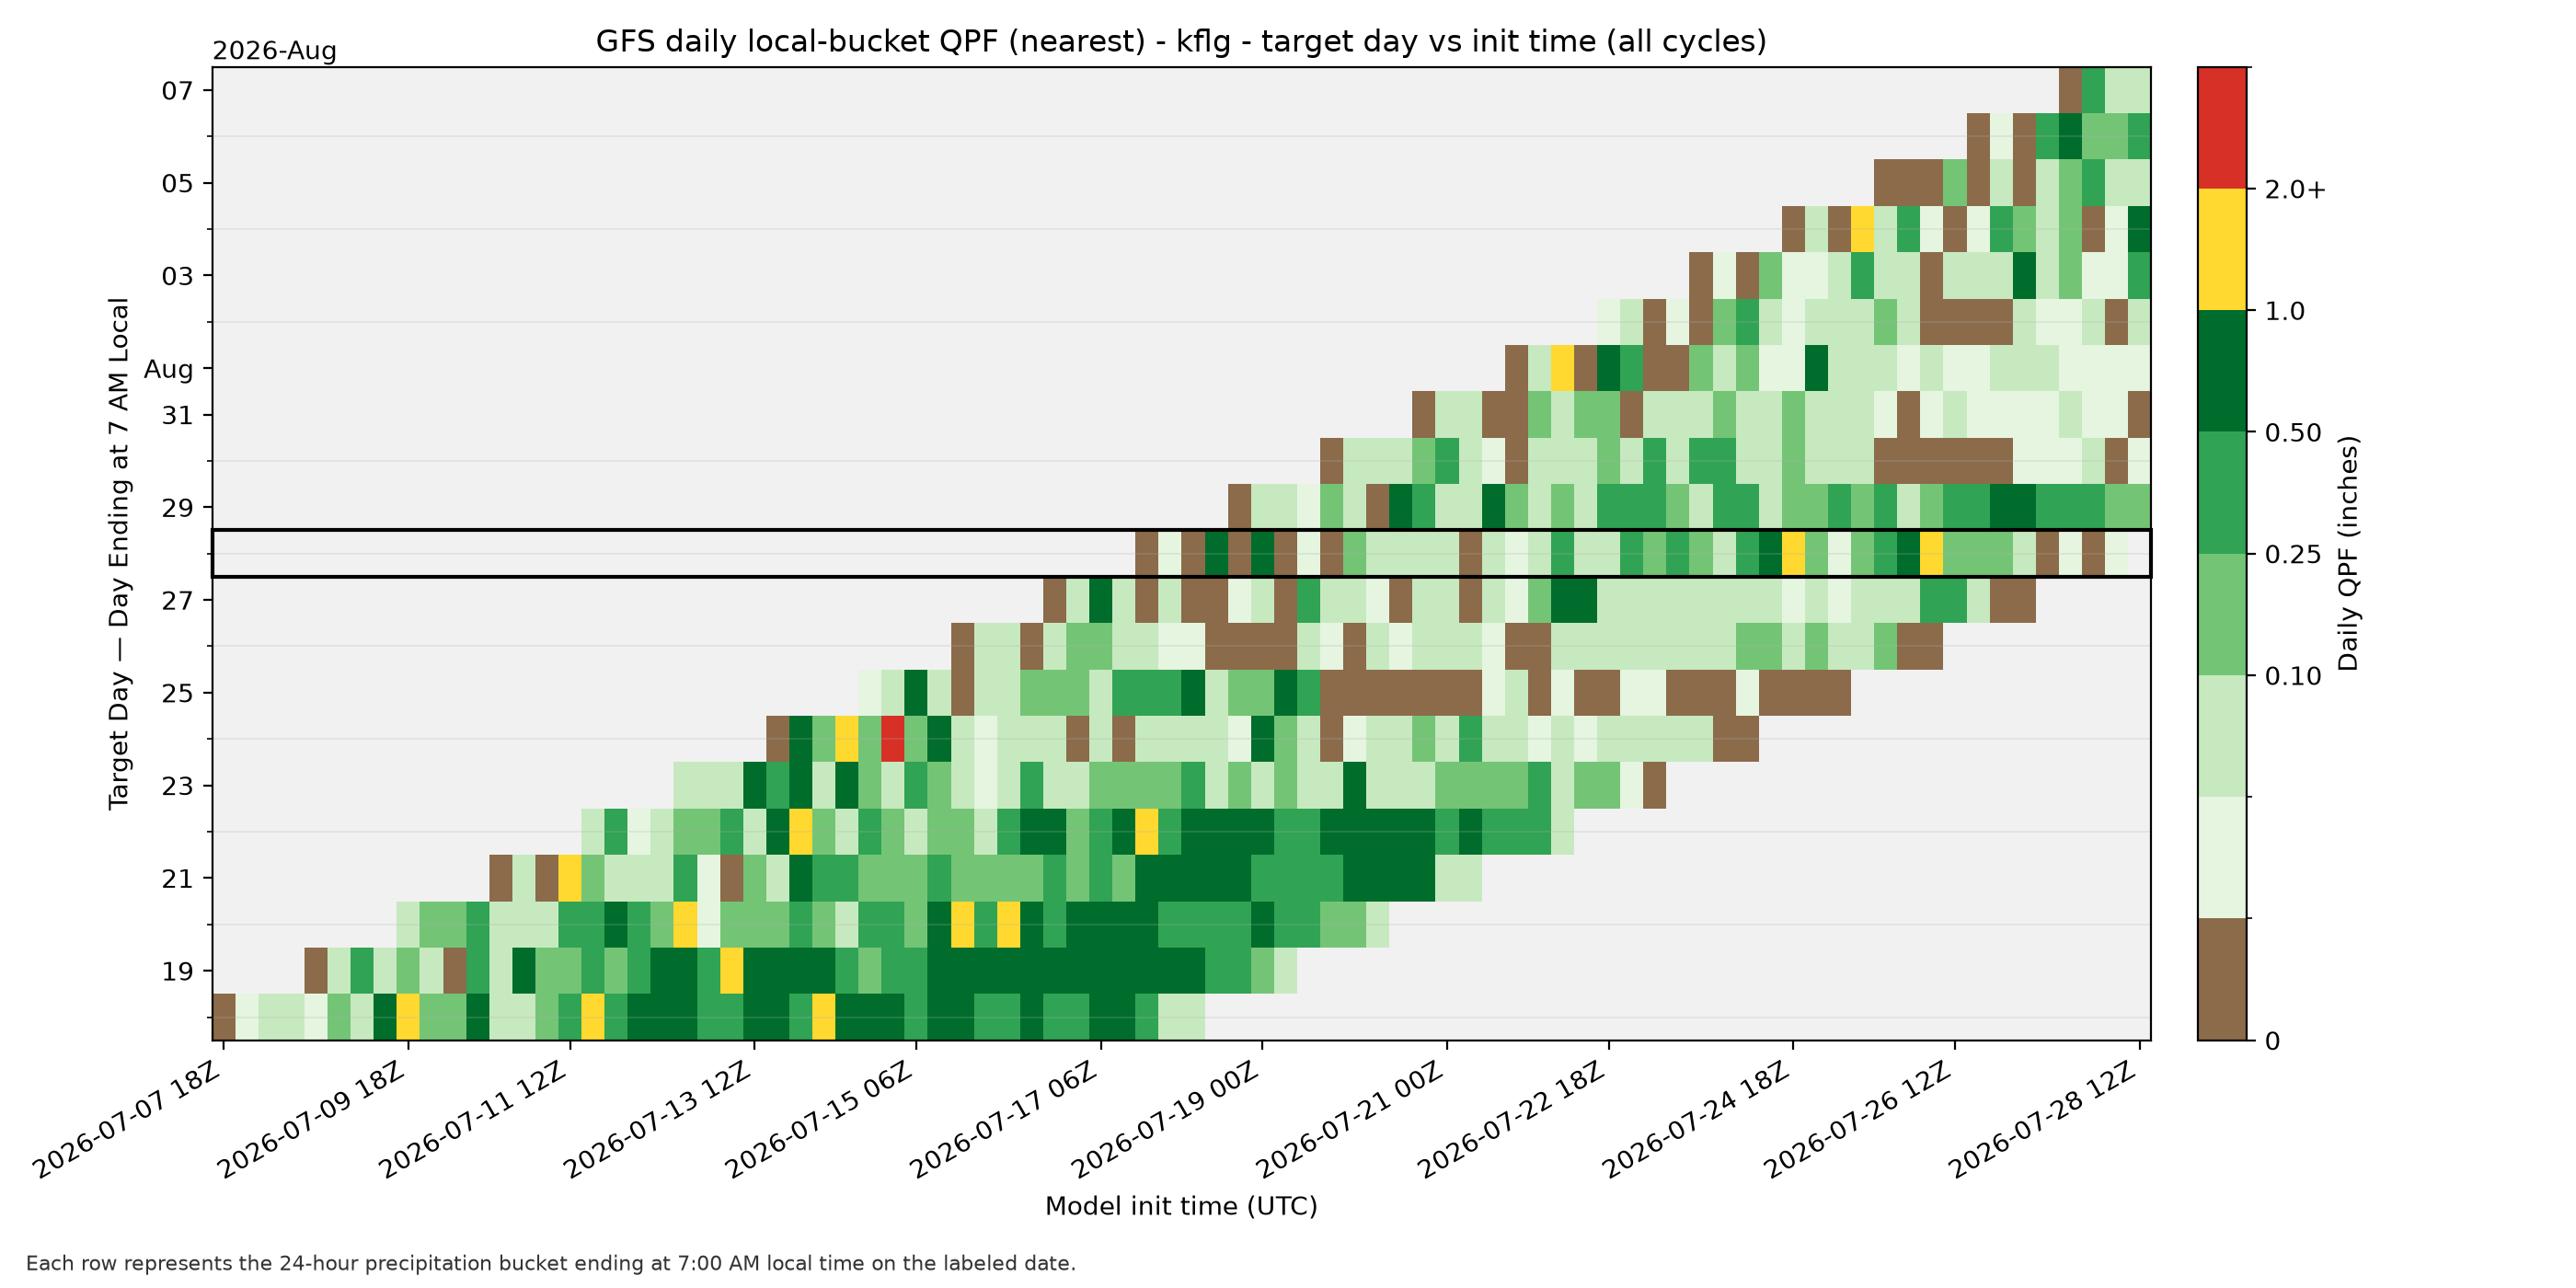
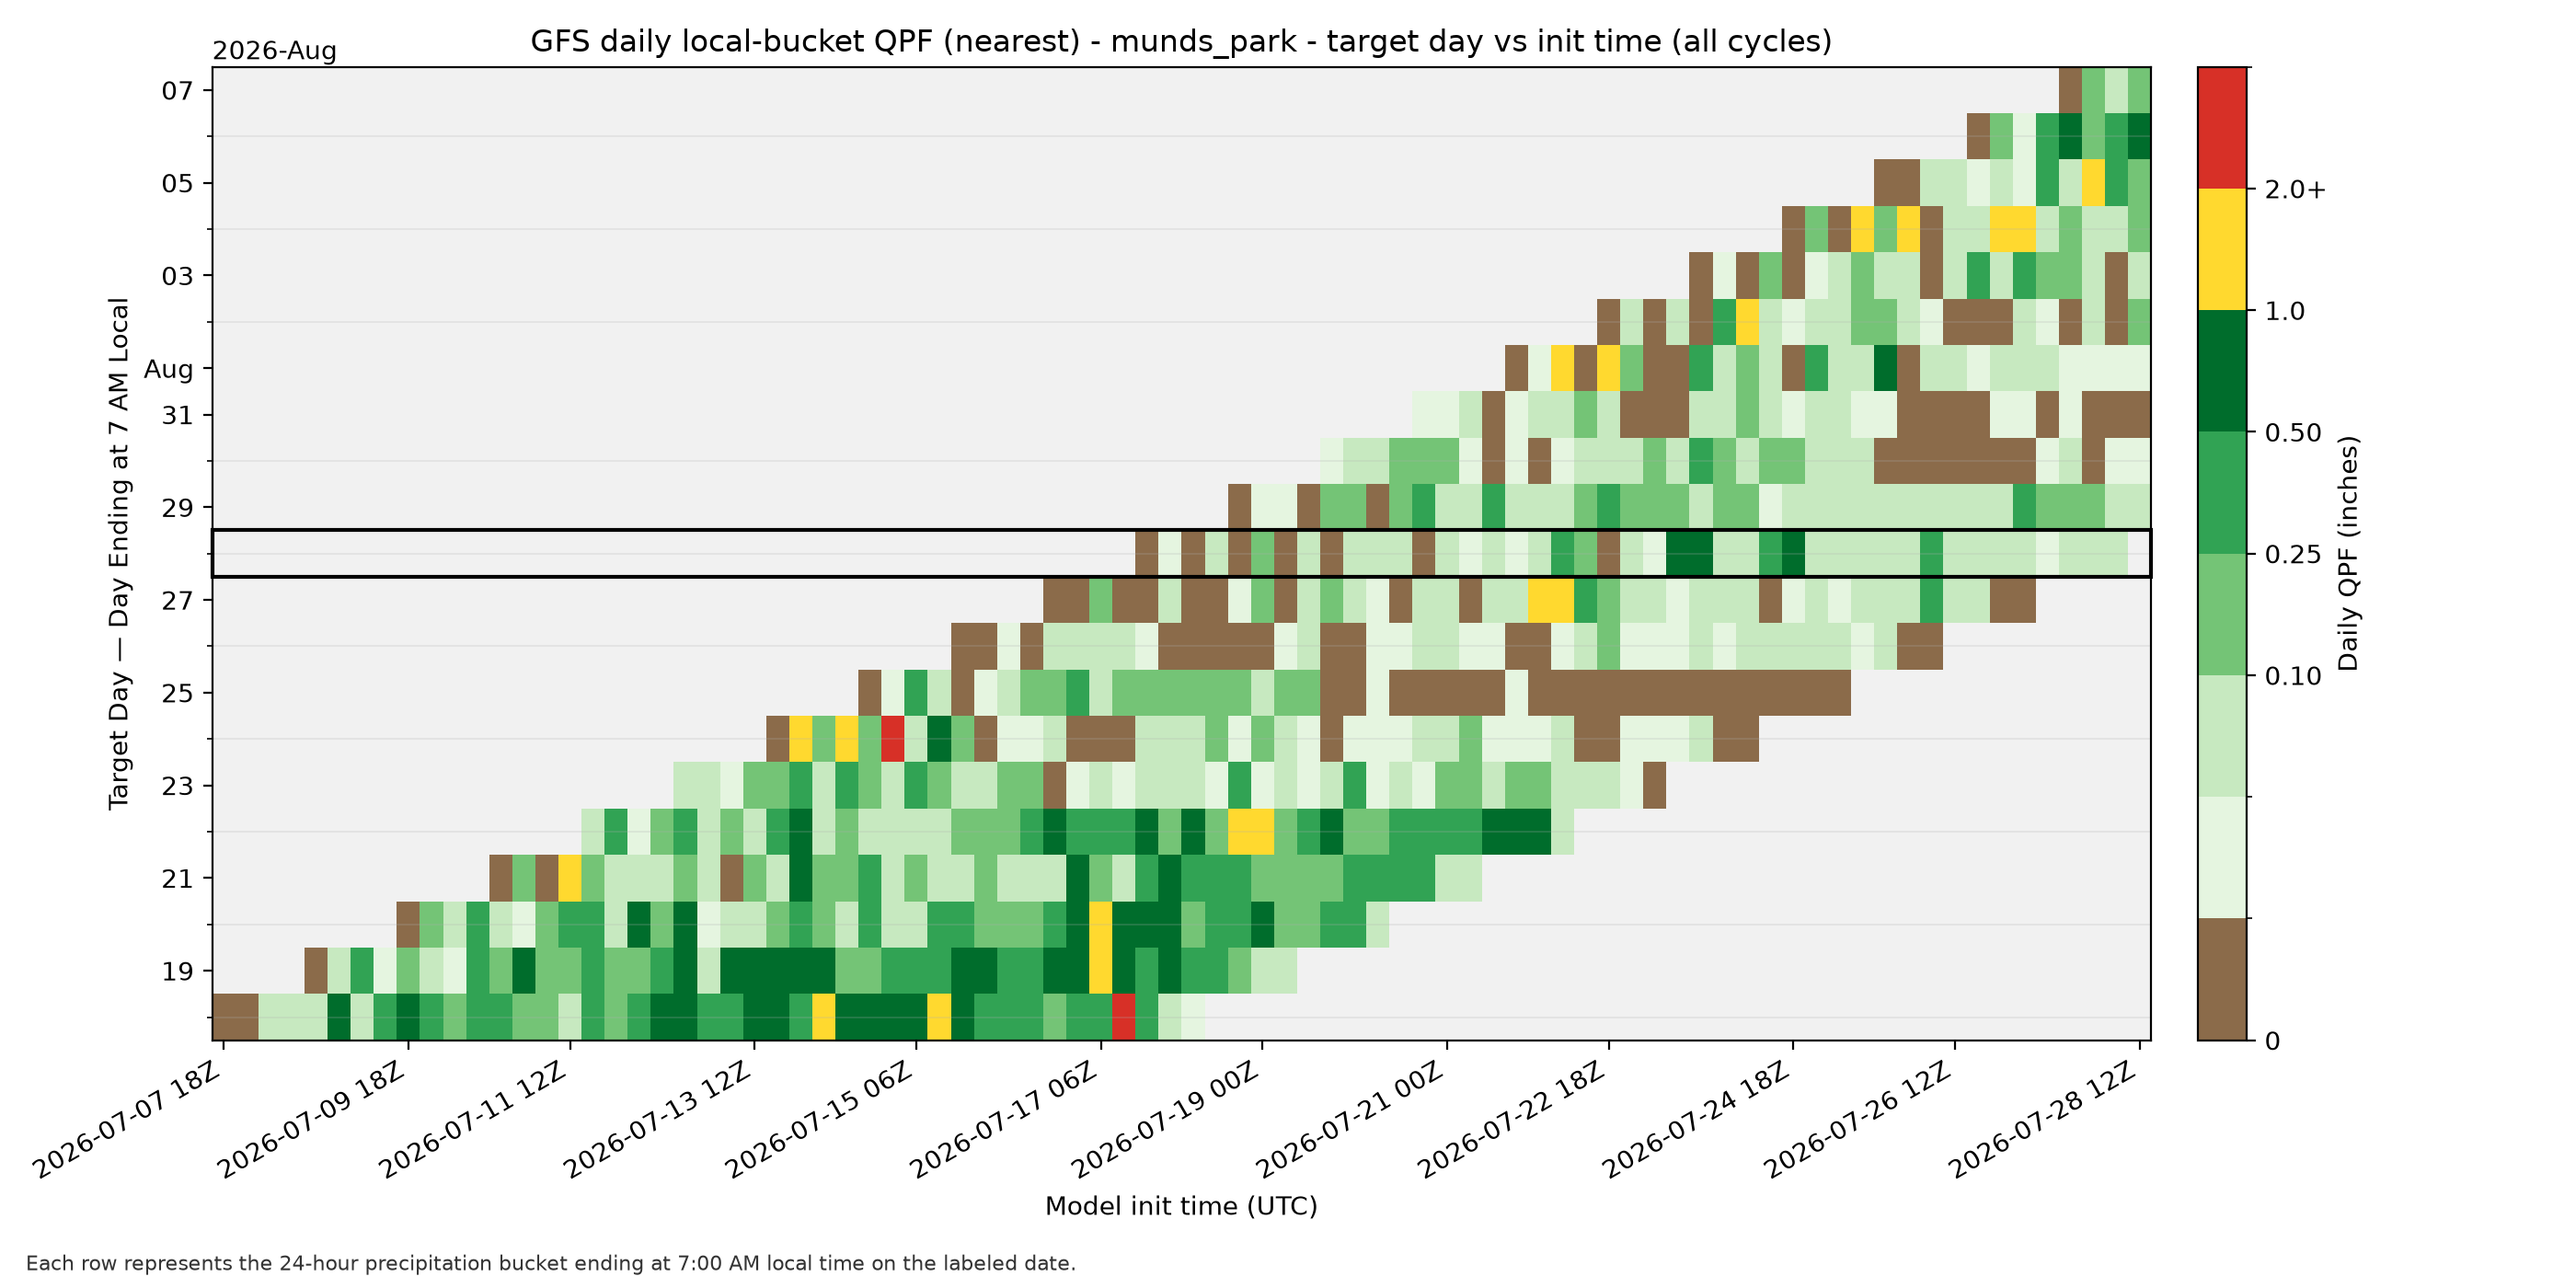
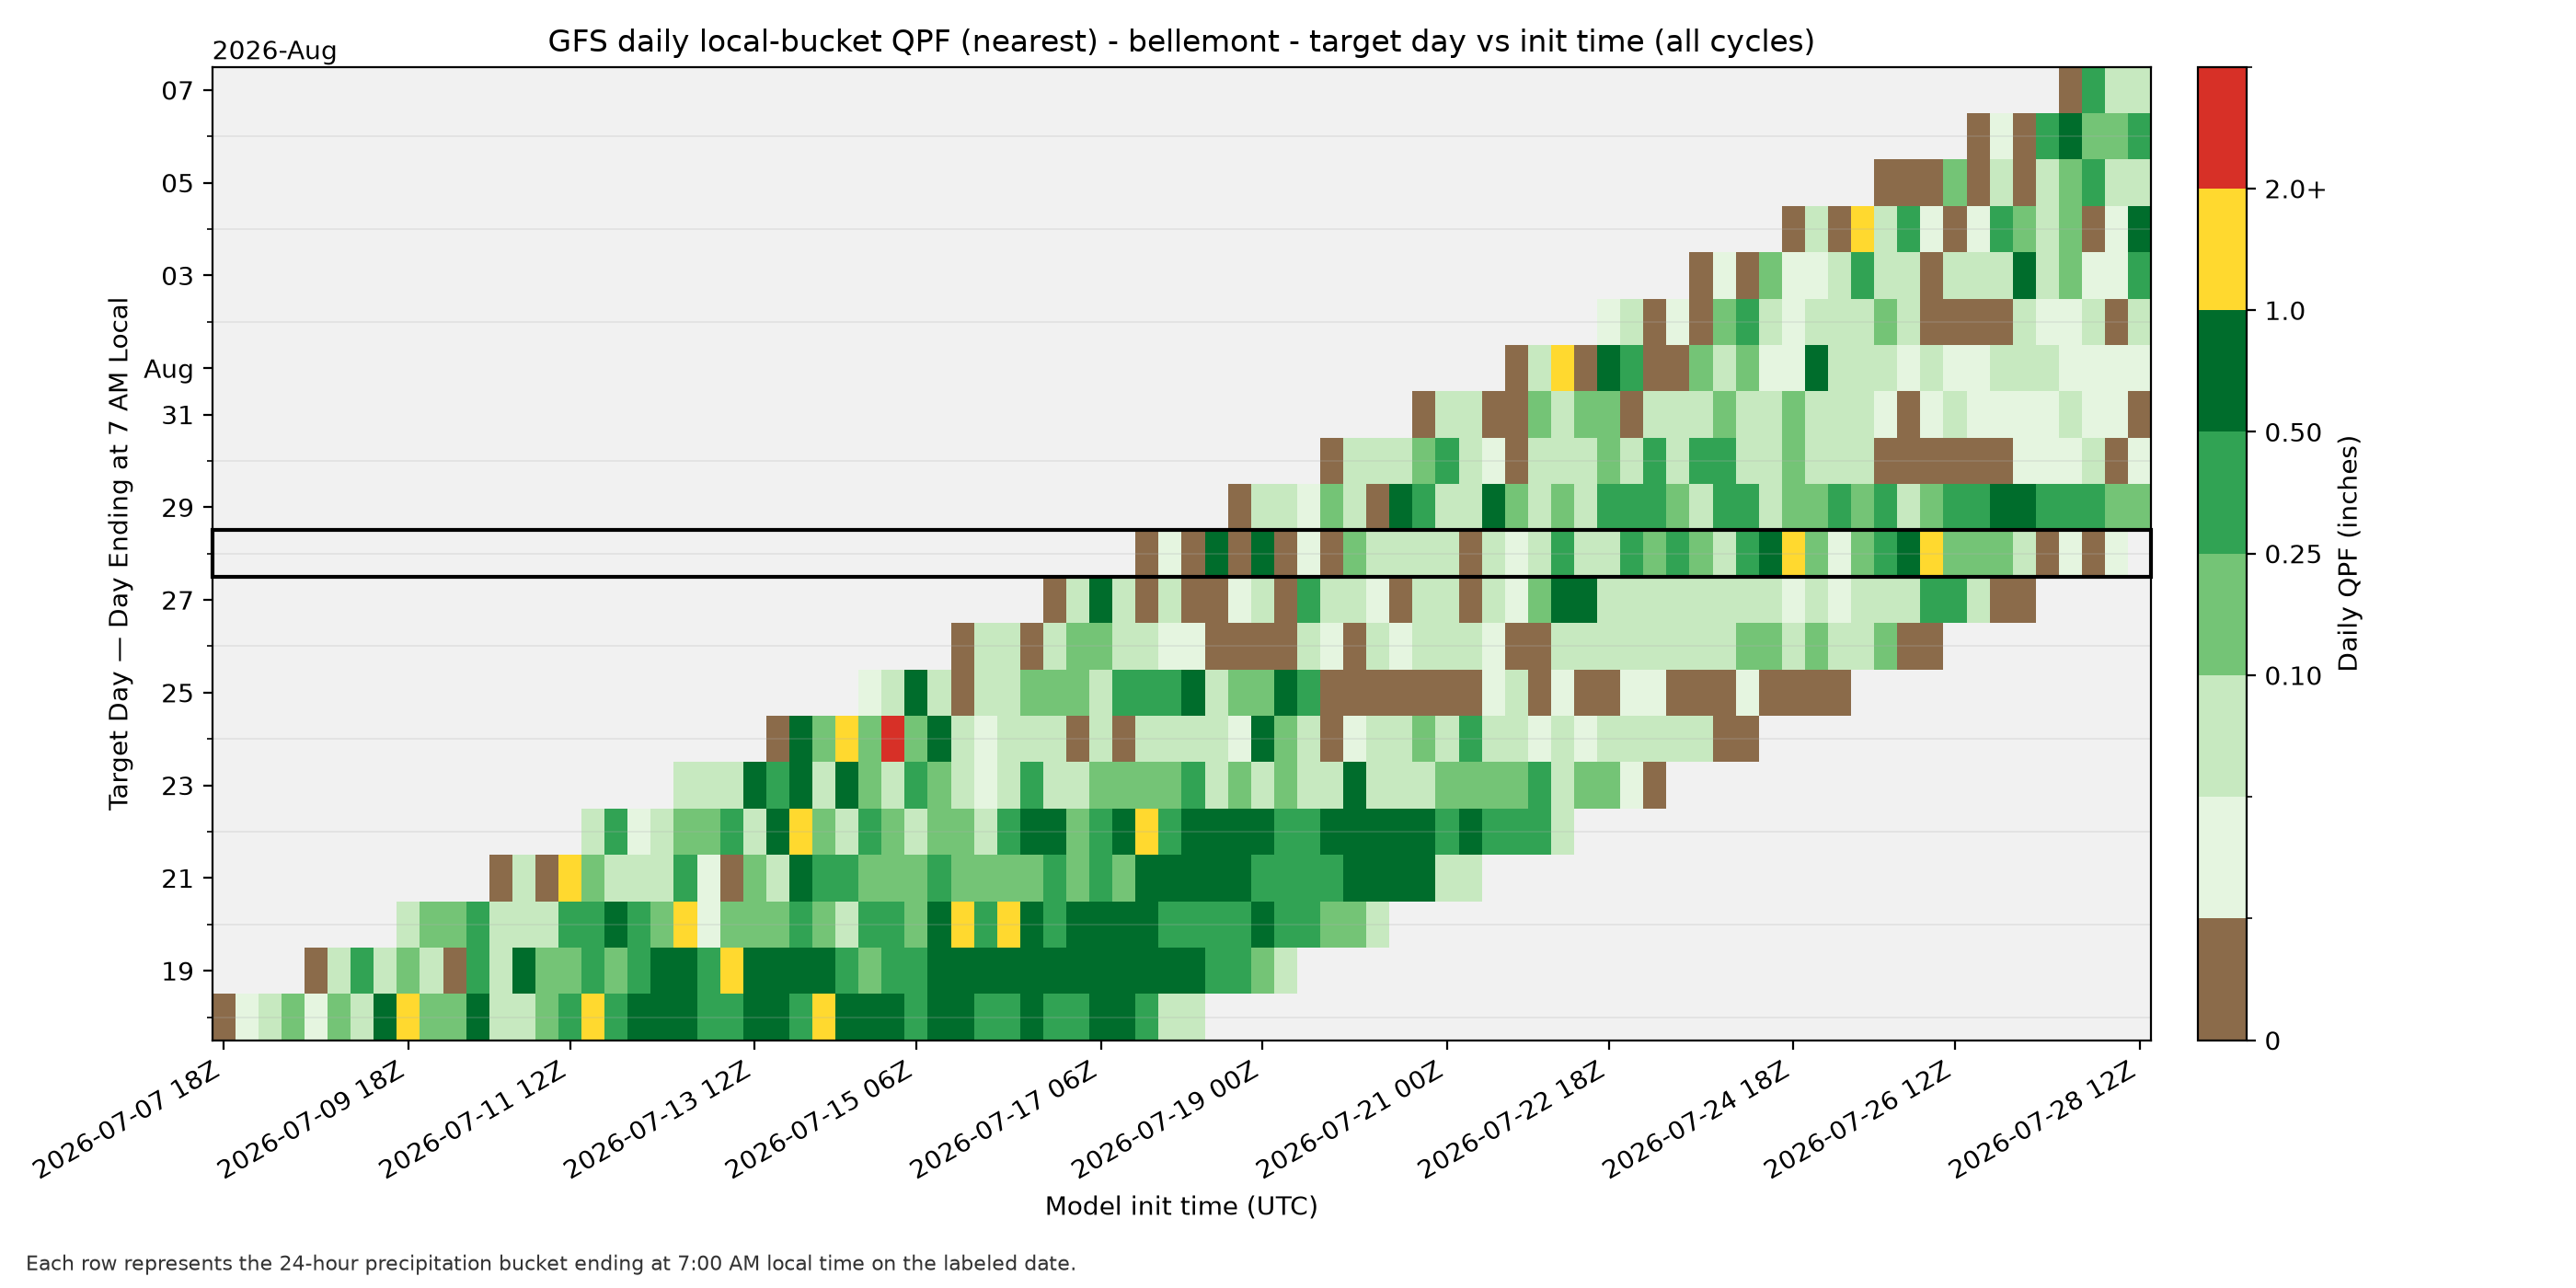
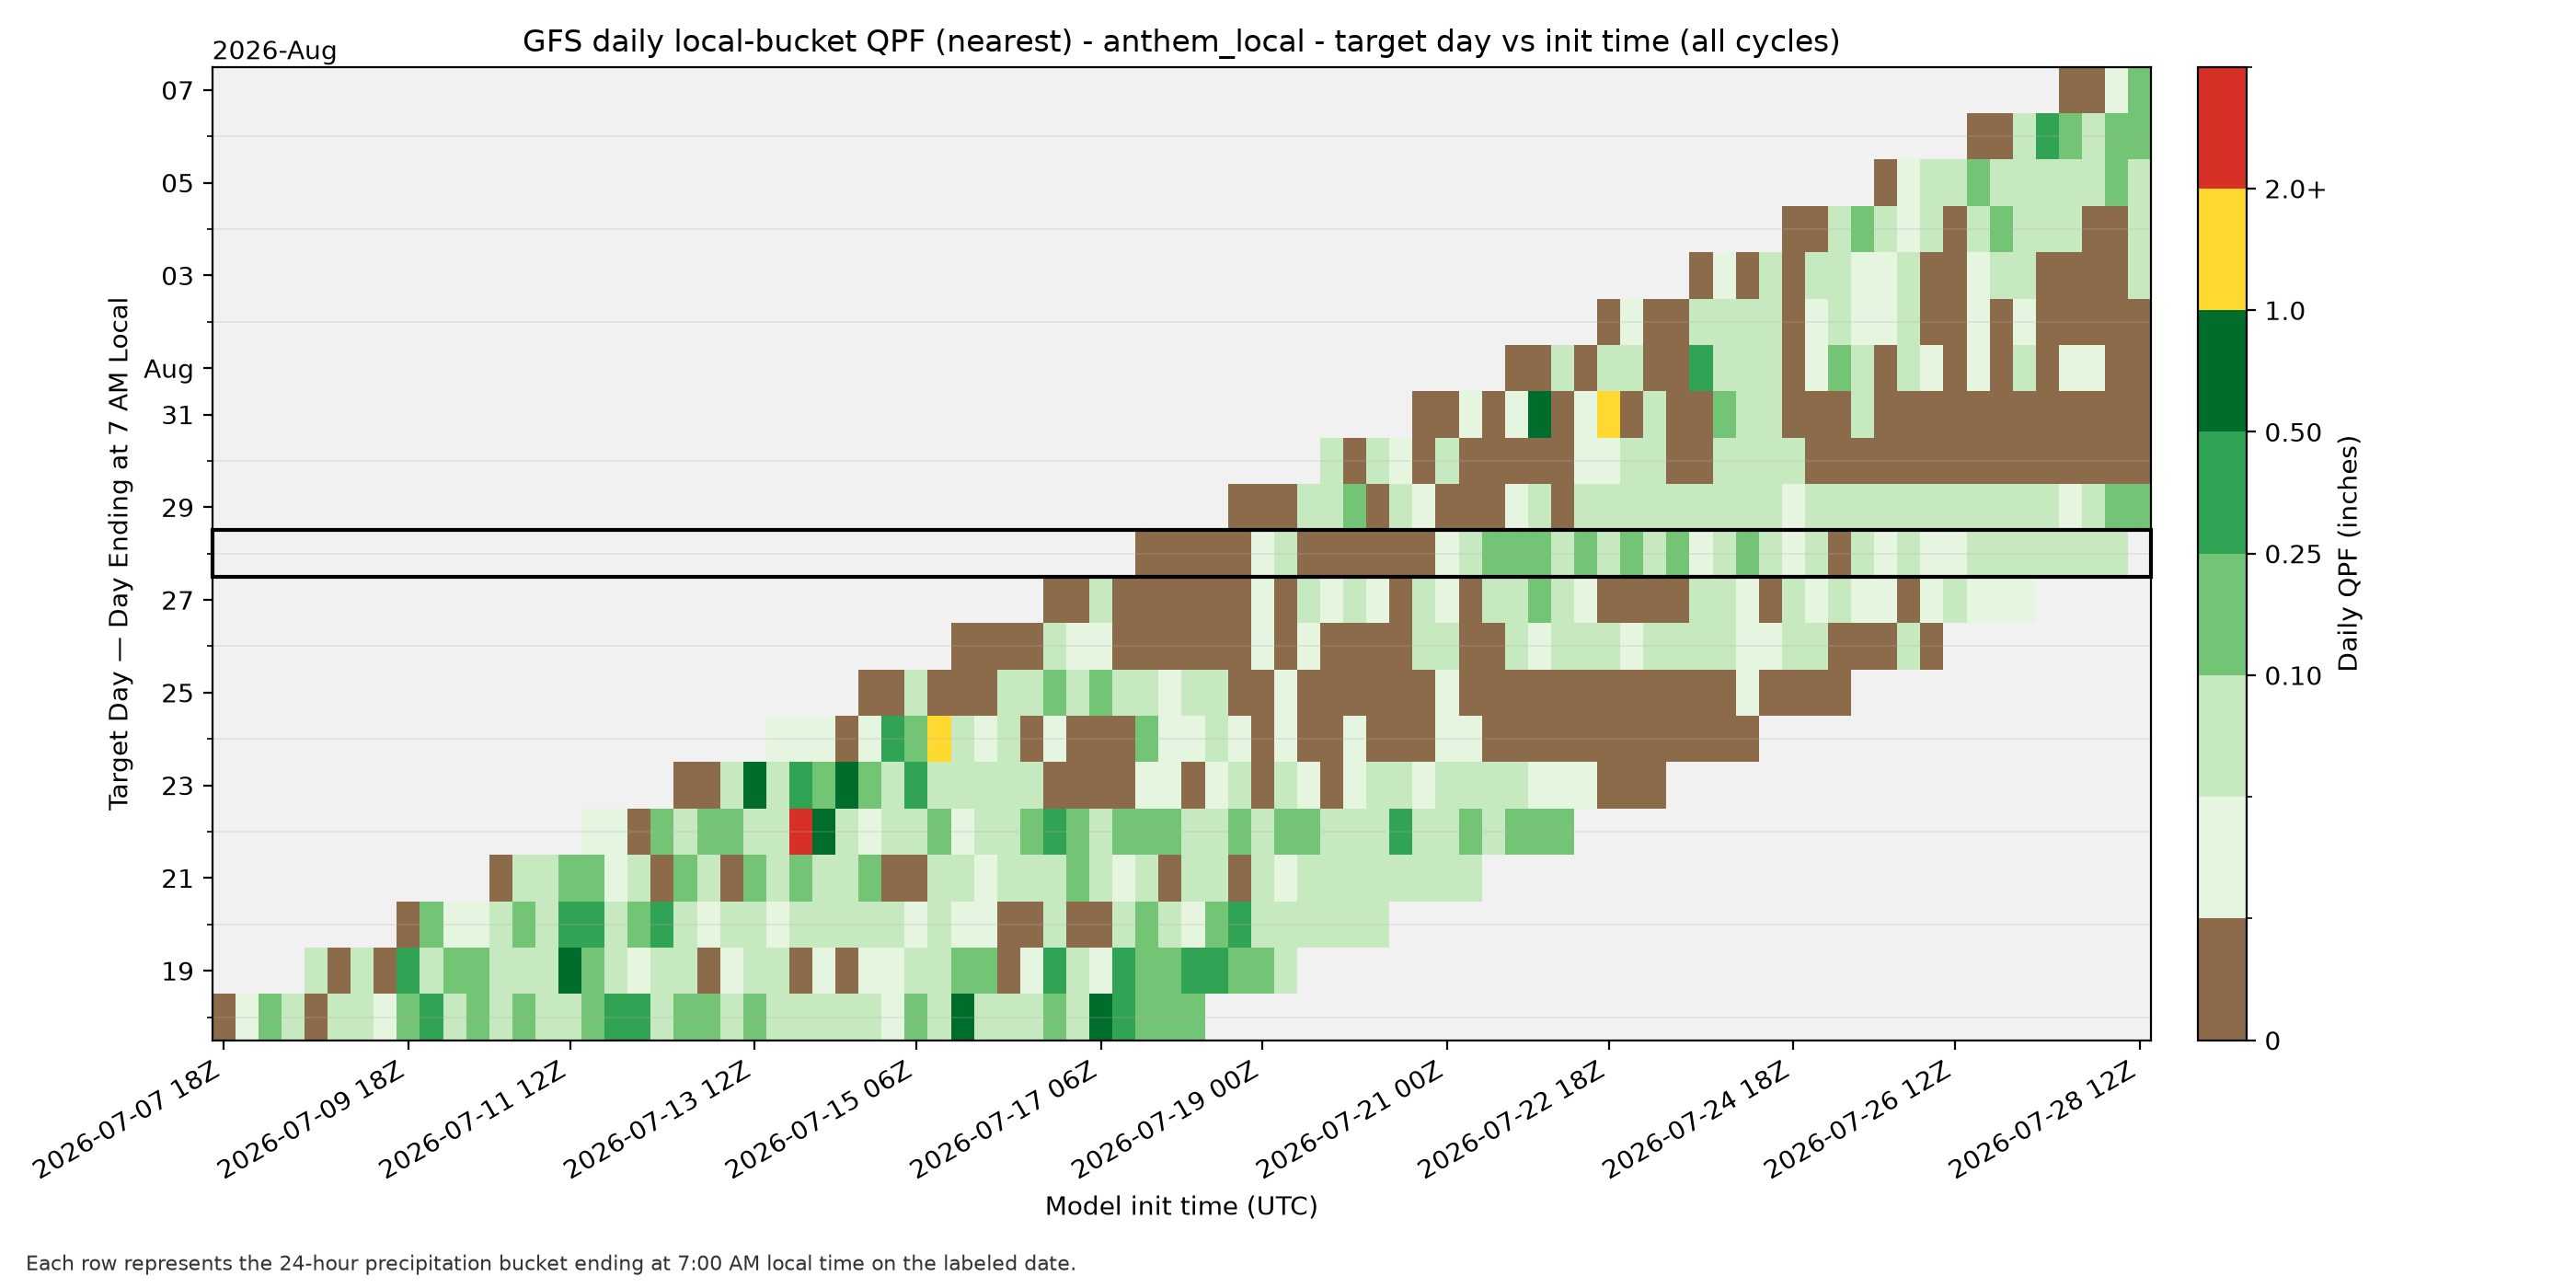
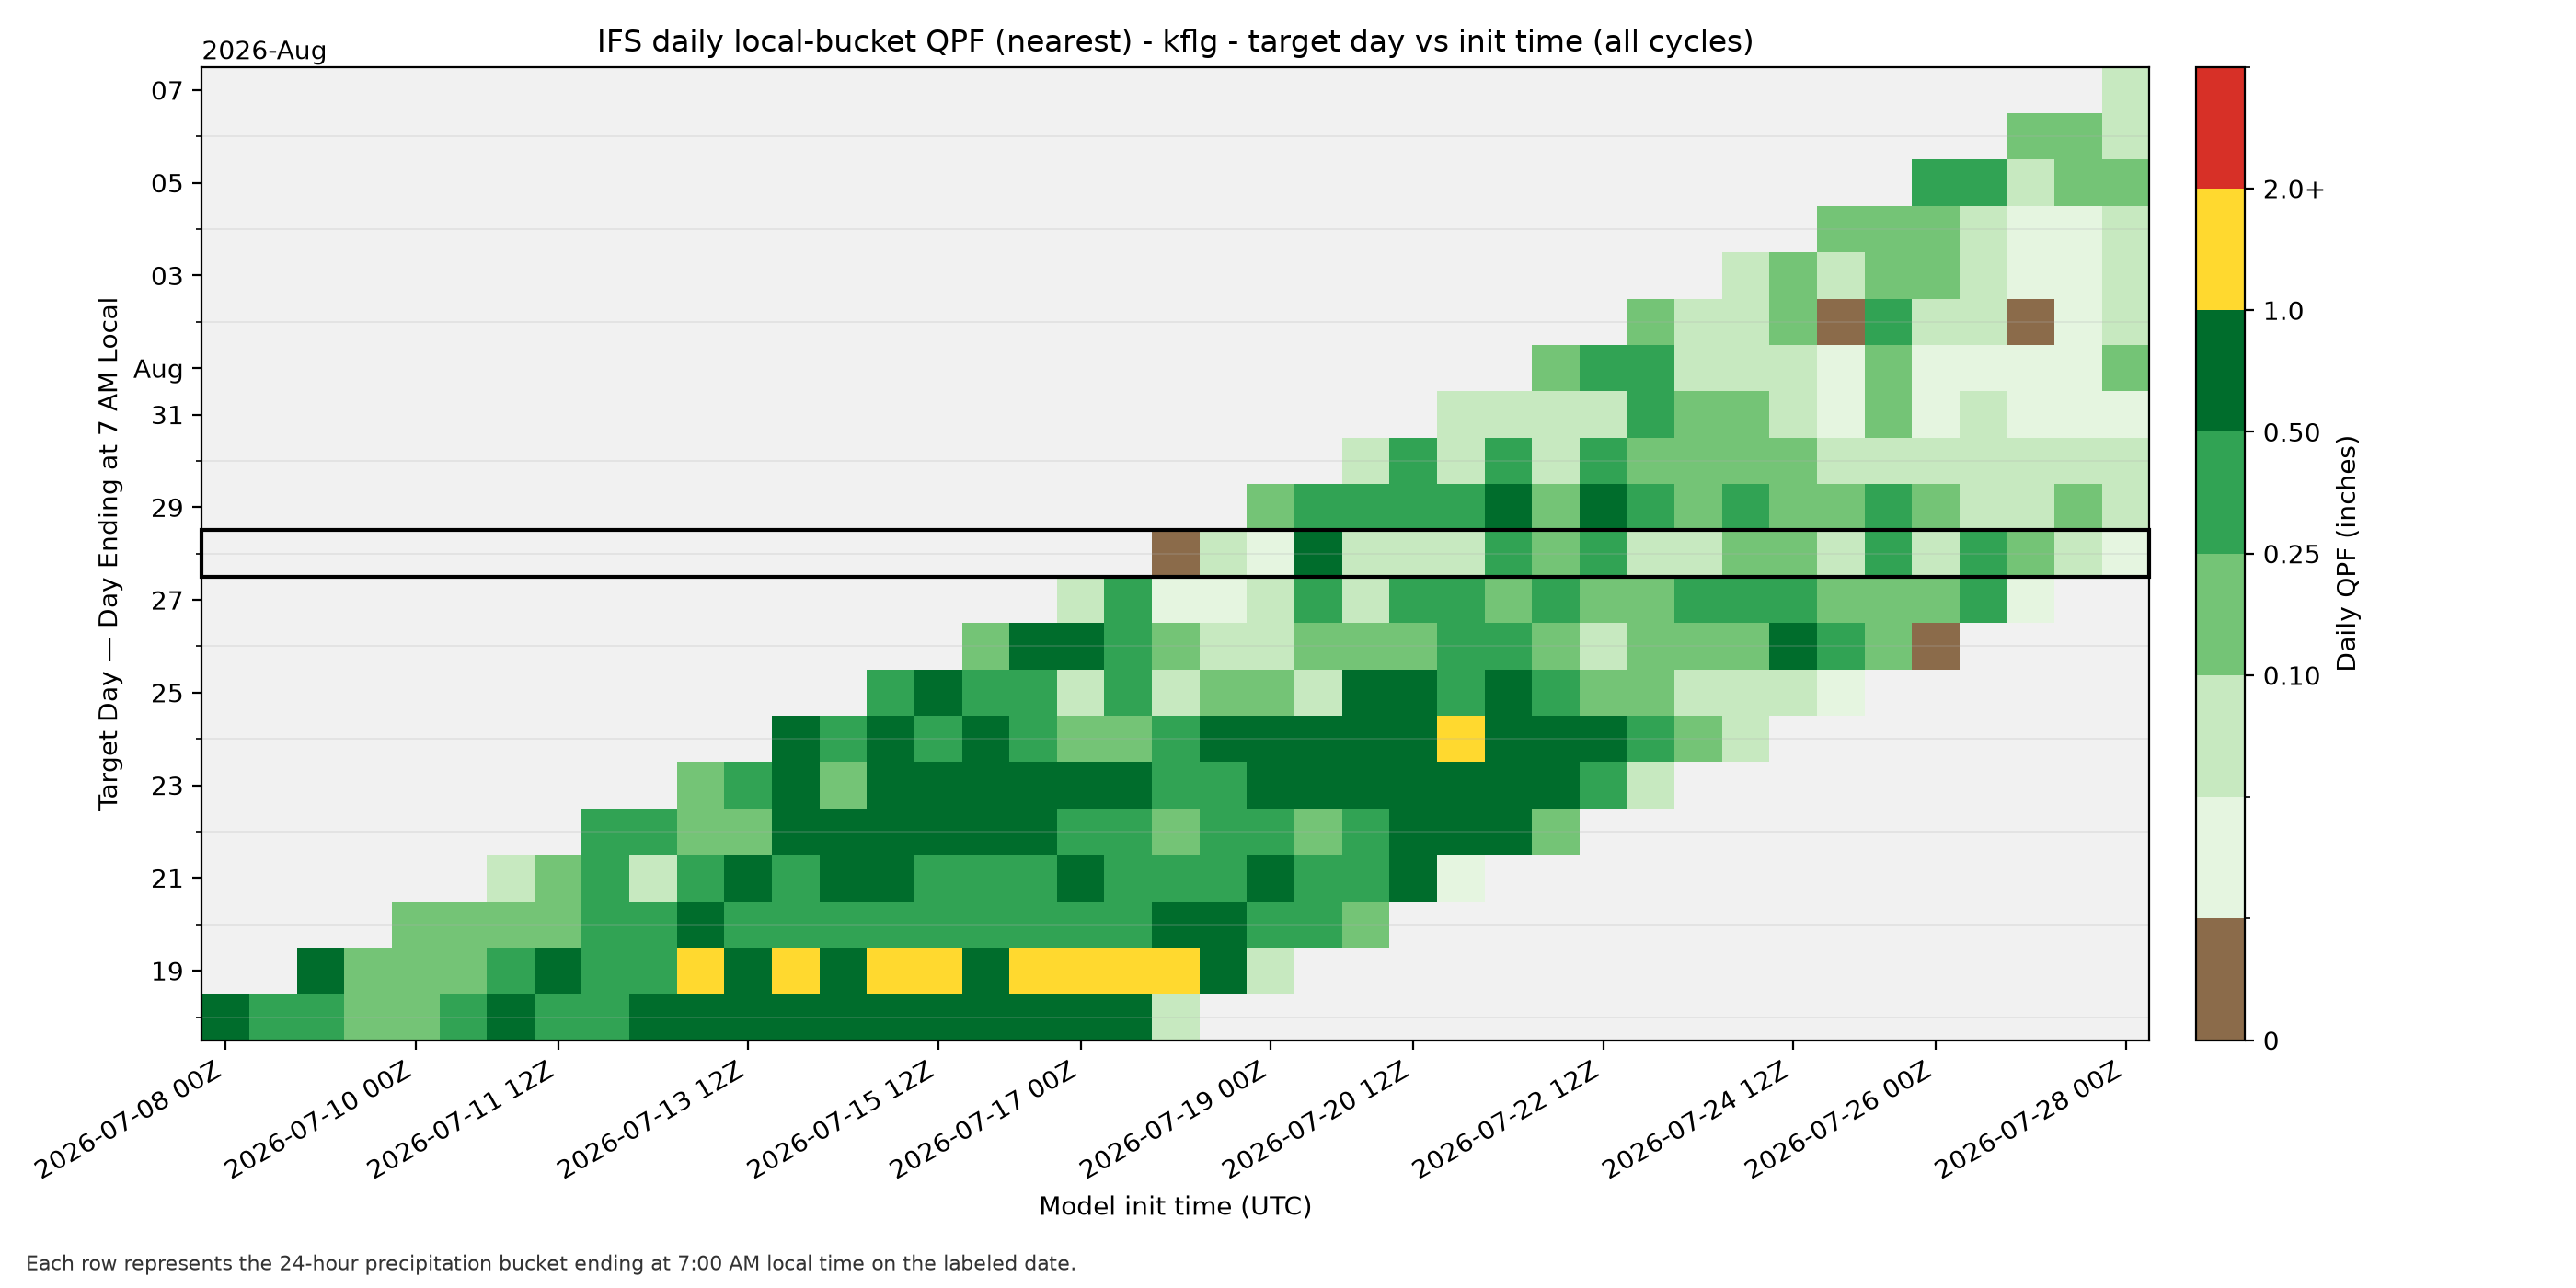
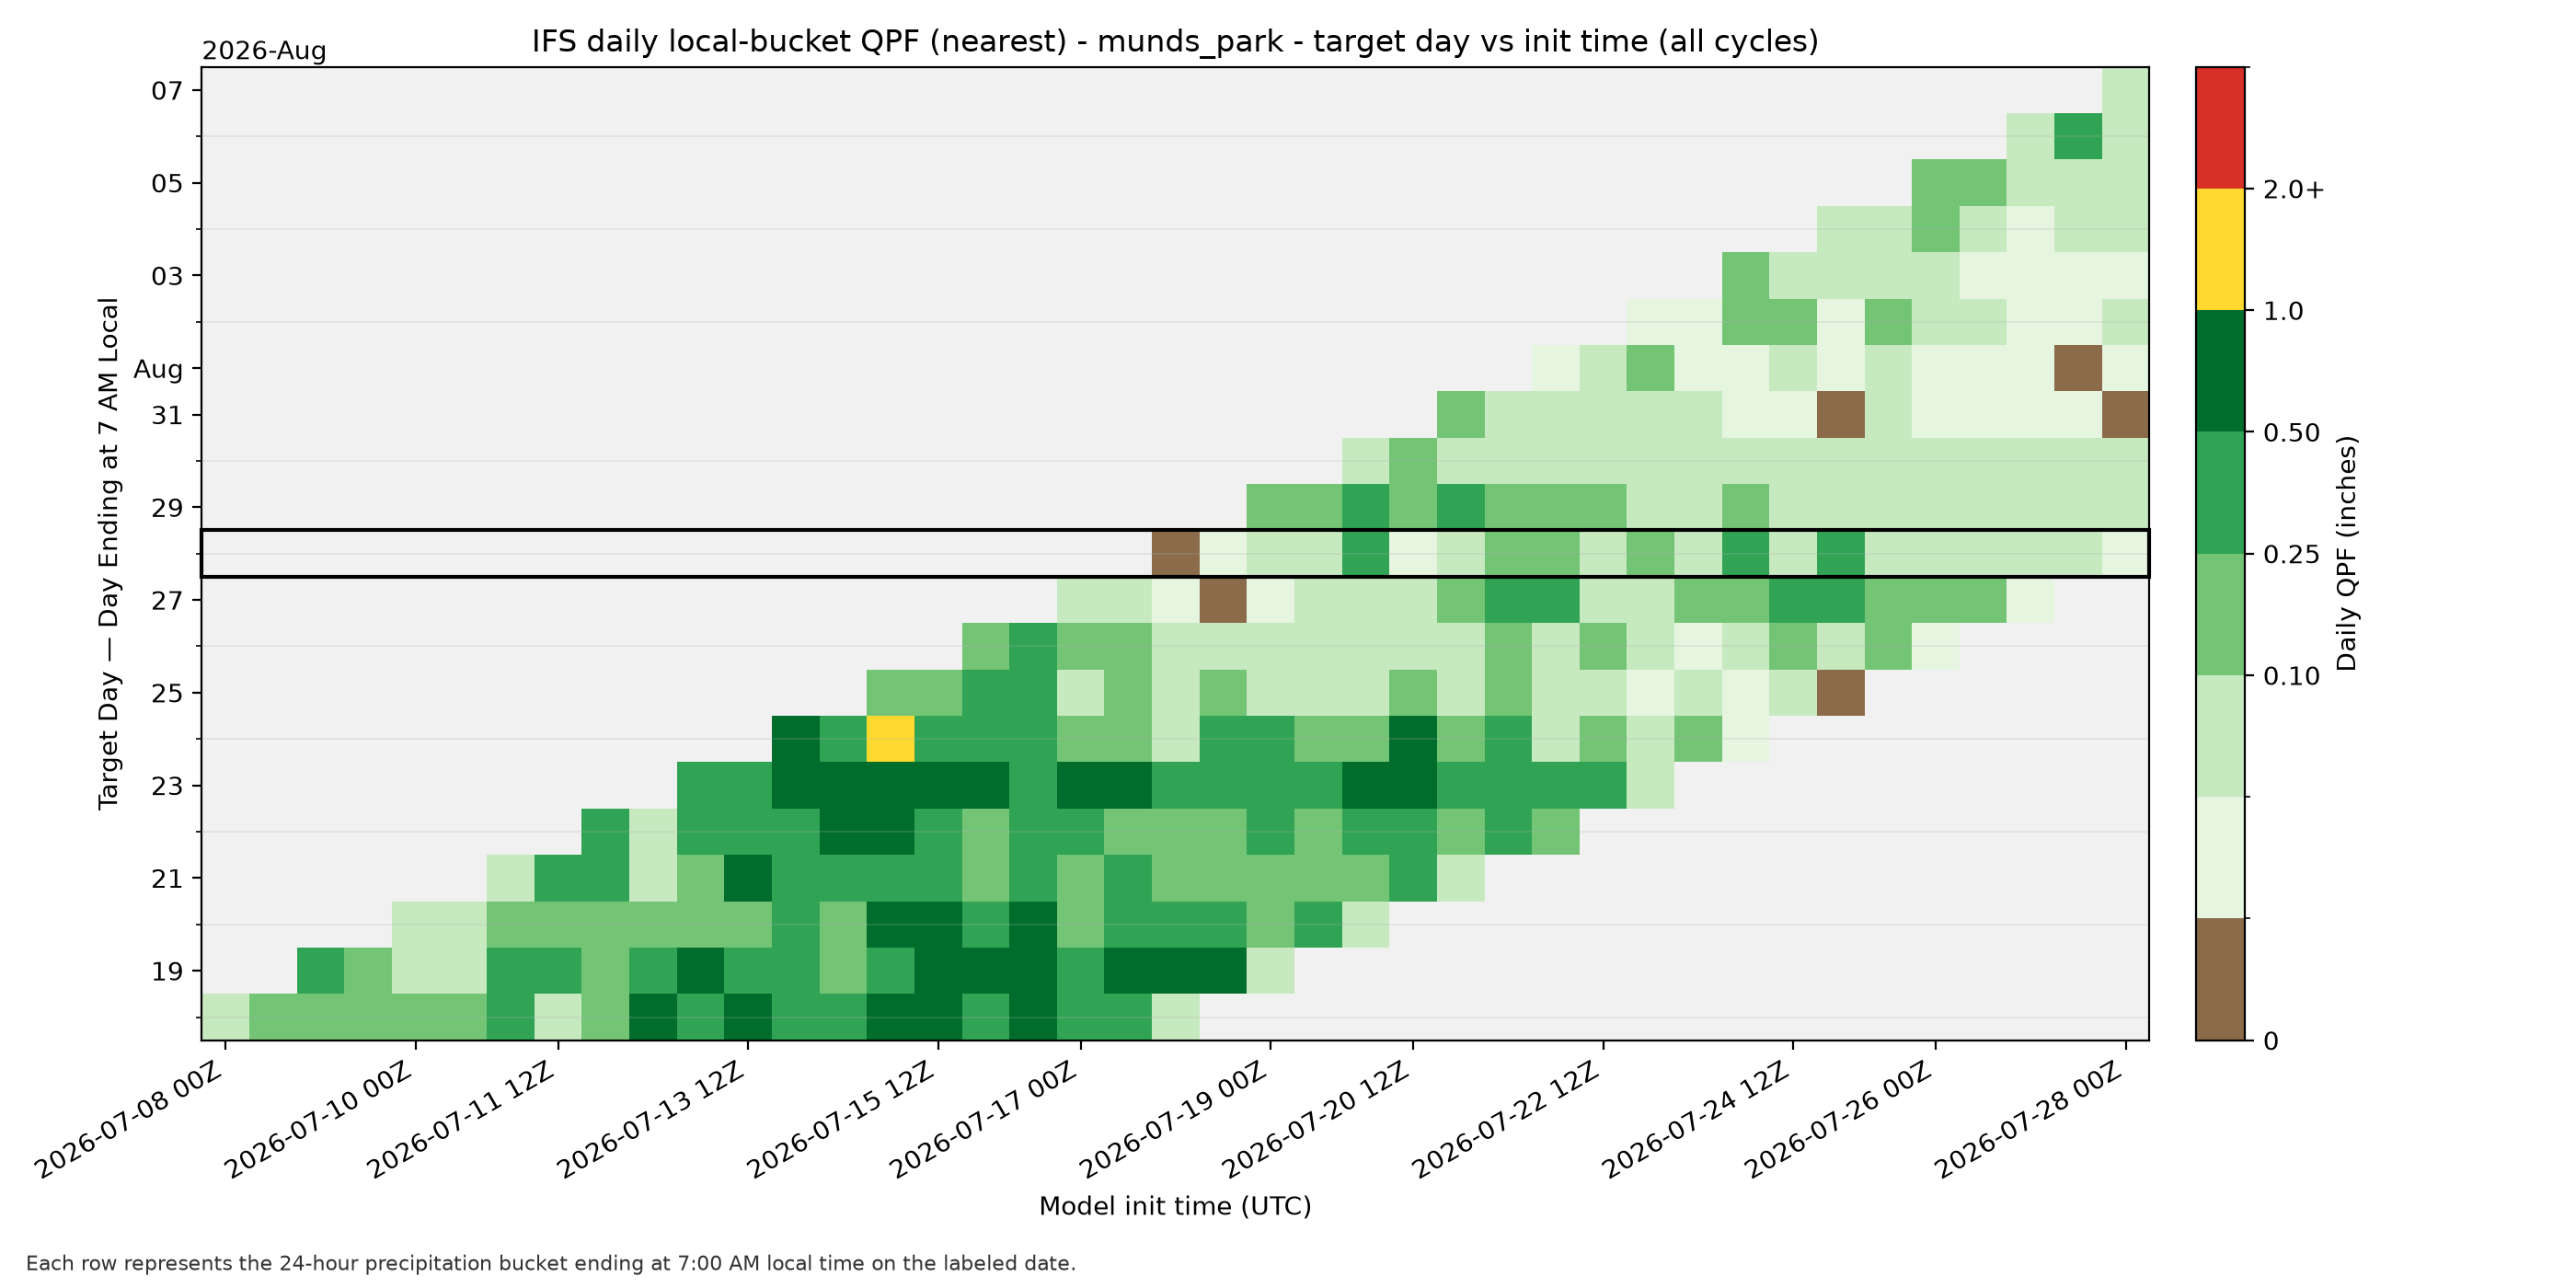
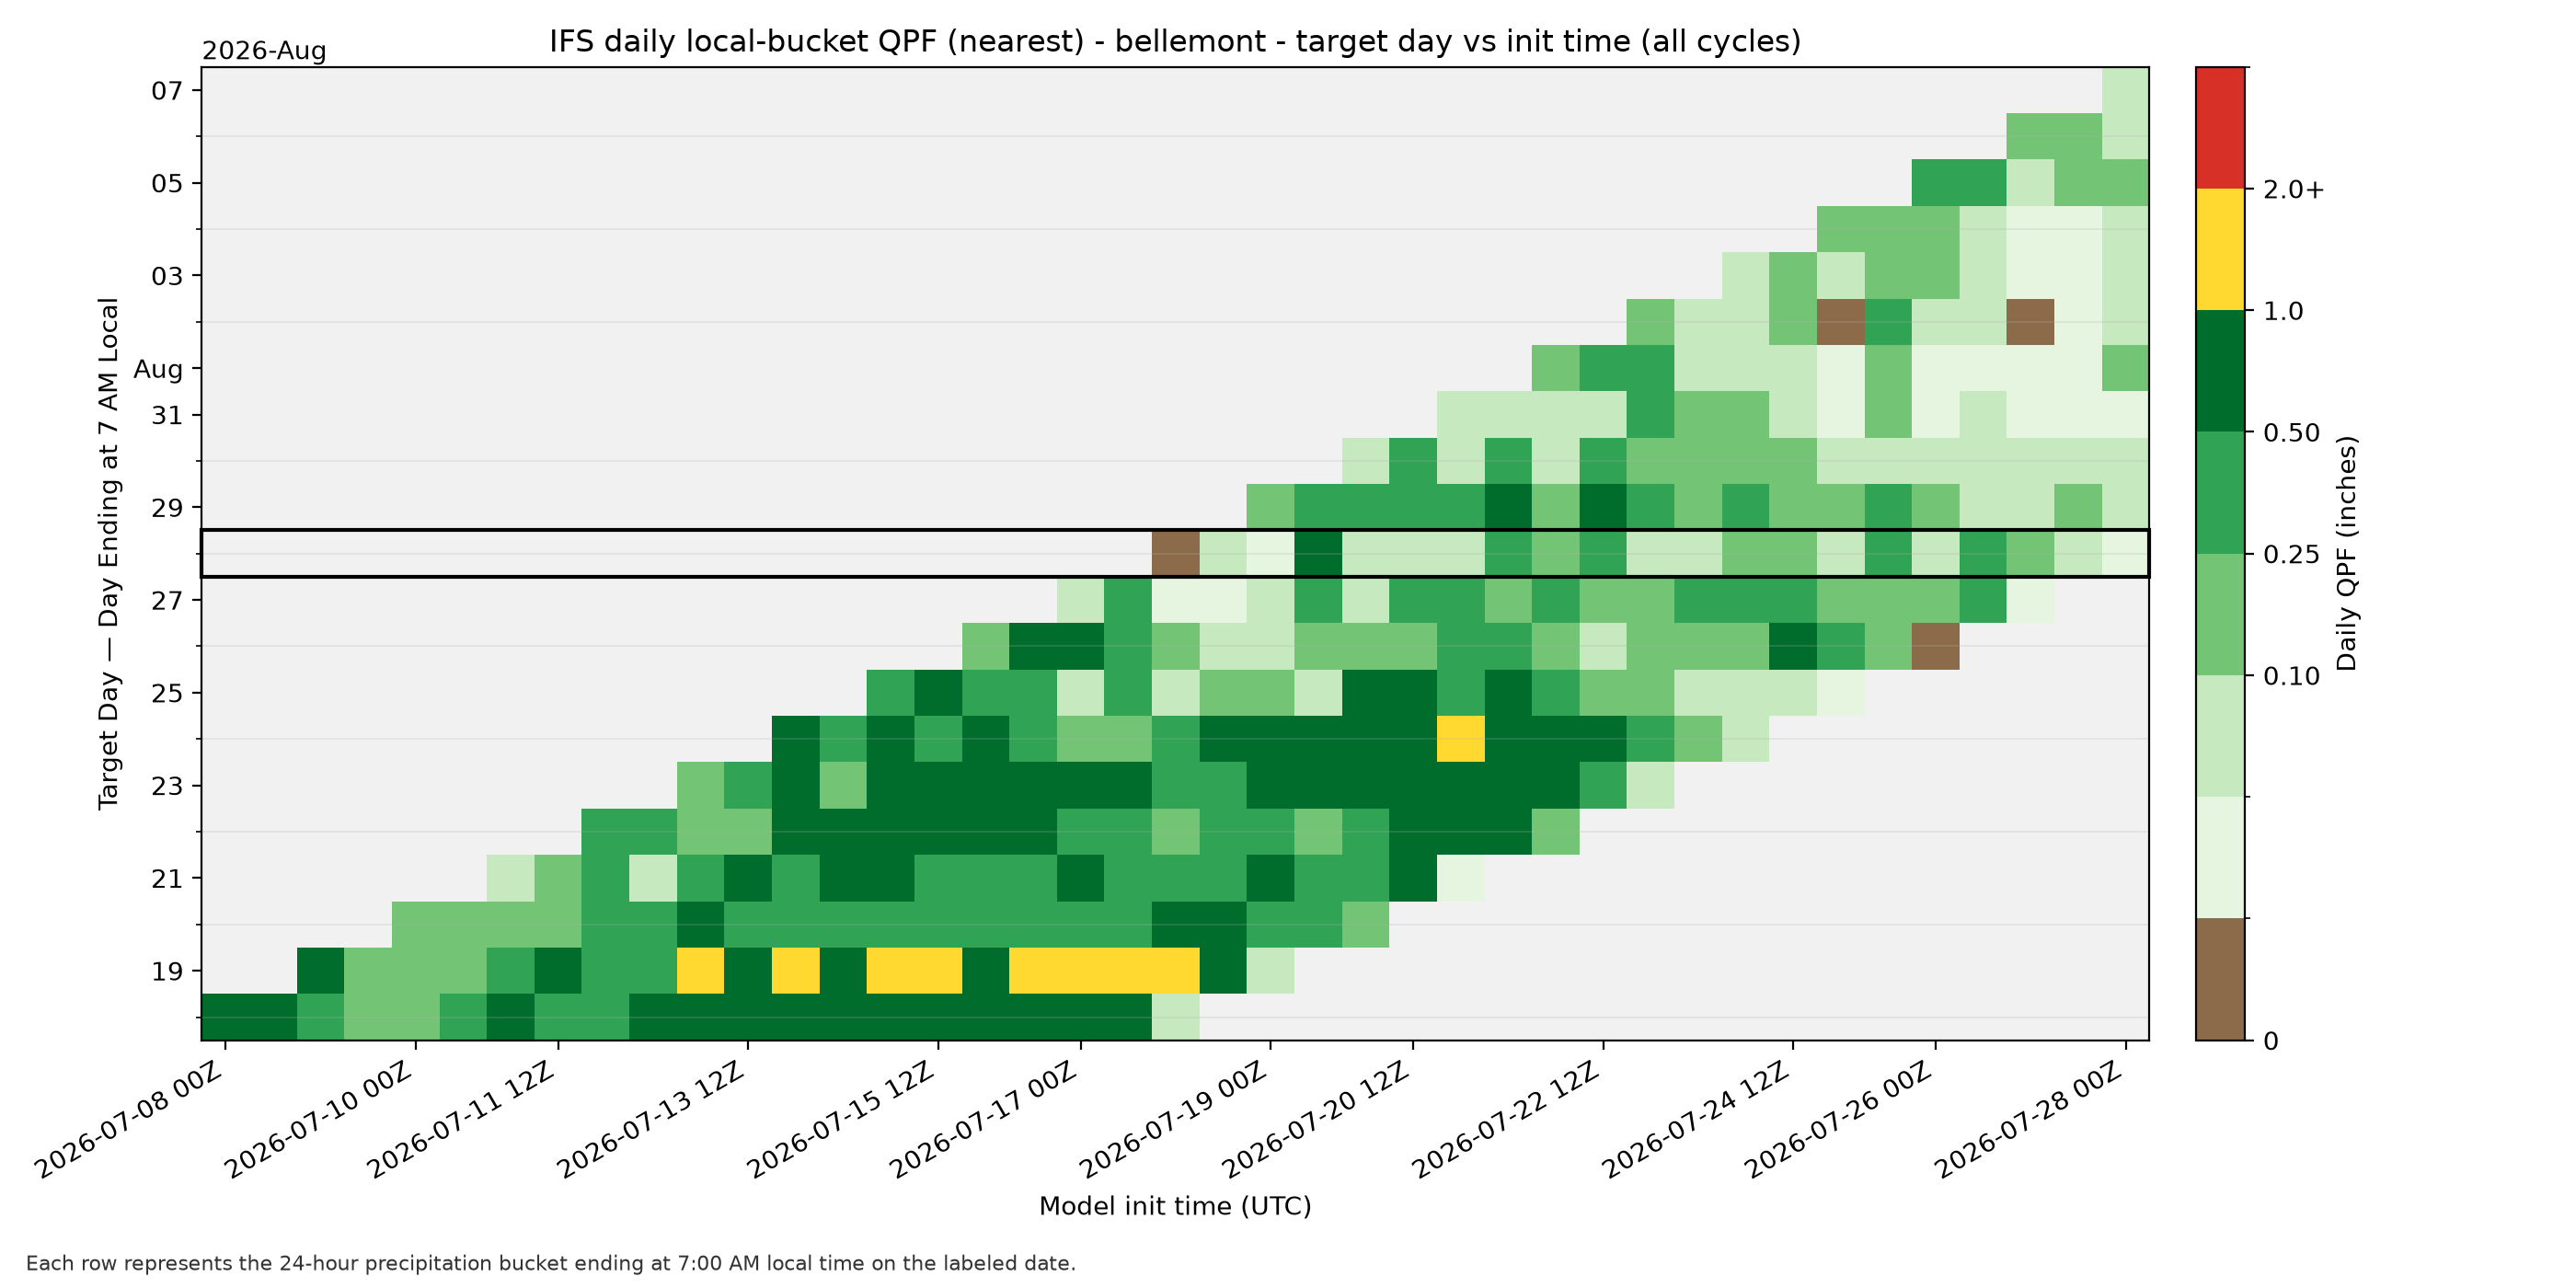
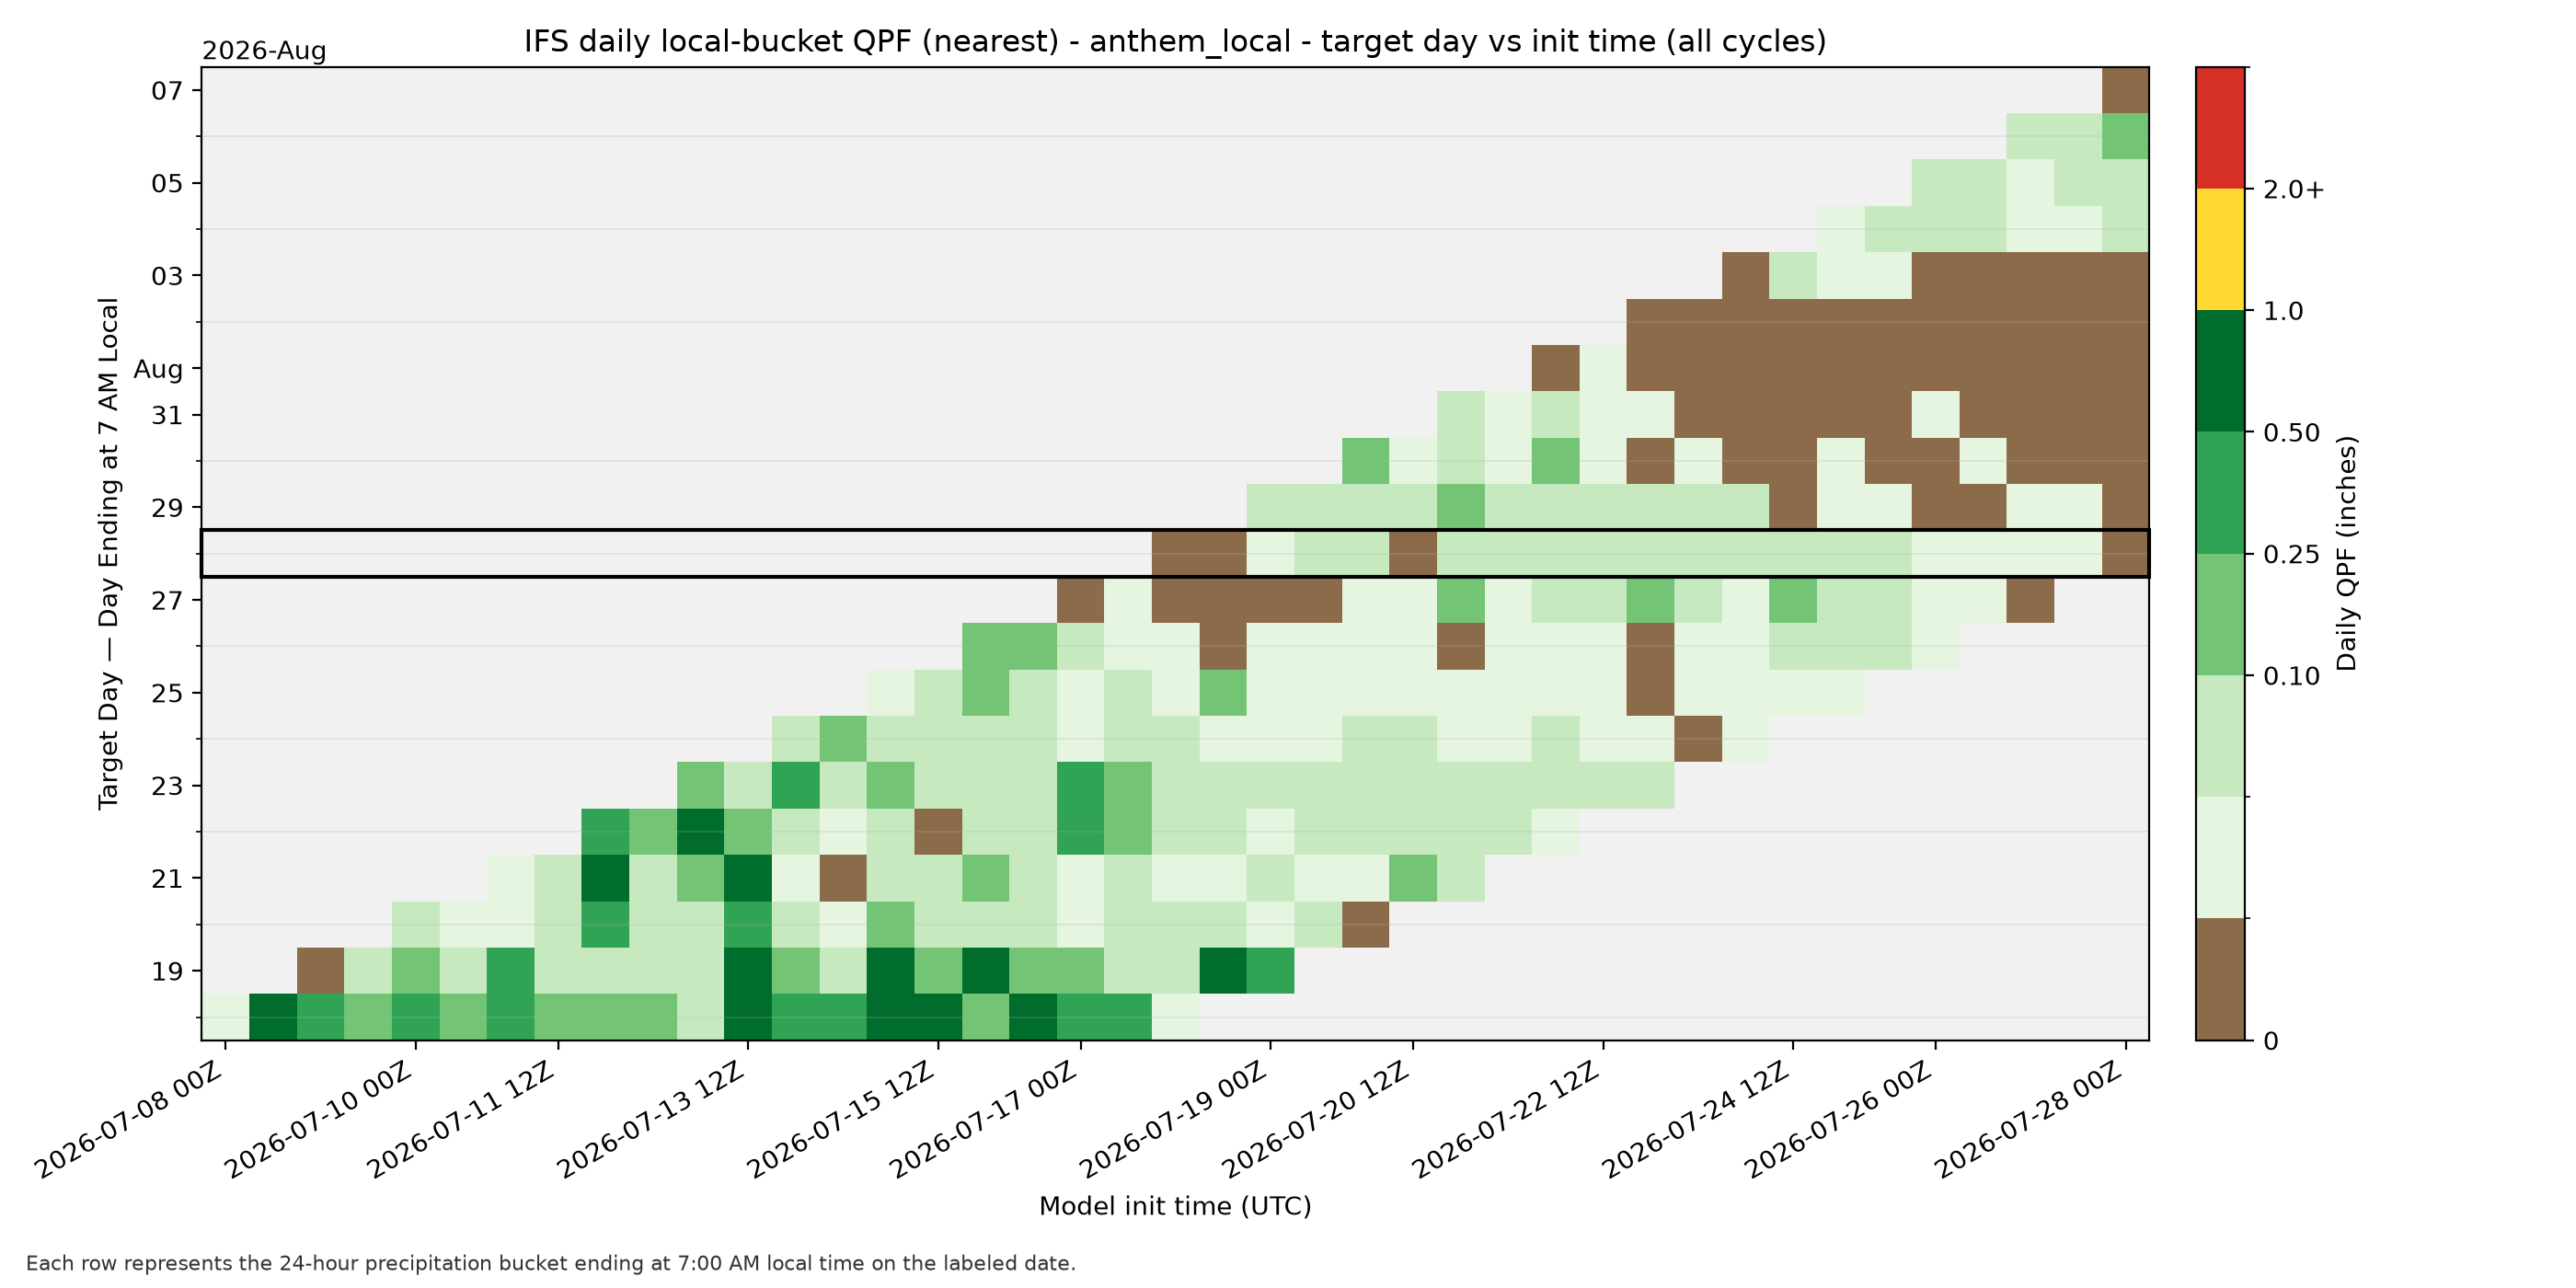
Each image below is a heatmap: a grid of colored cells where color encodes a forecast
value, letting patterns across many forecast runs and days show up at a glance.
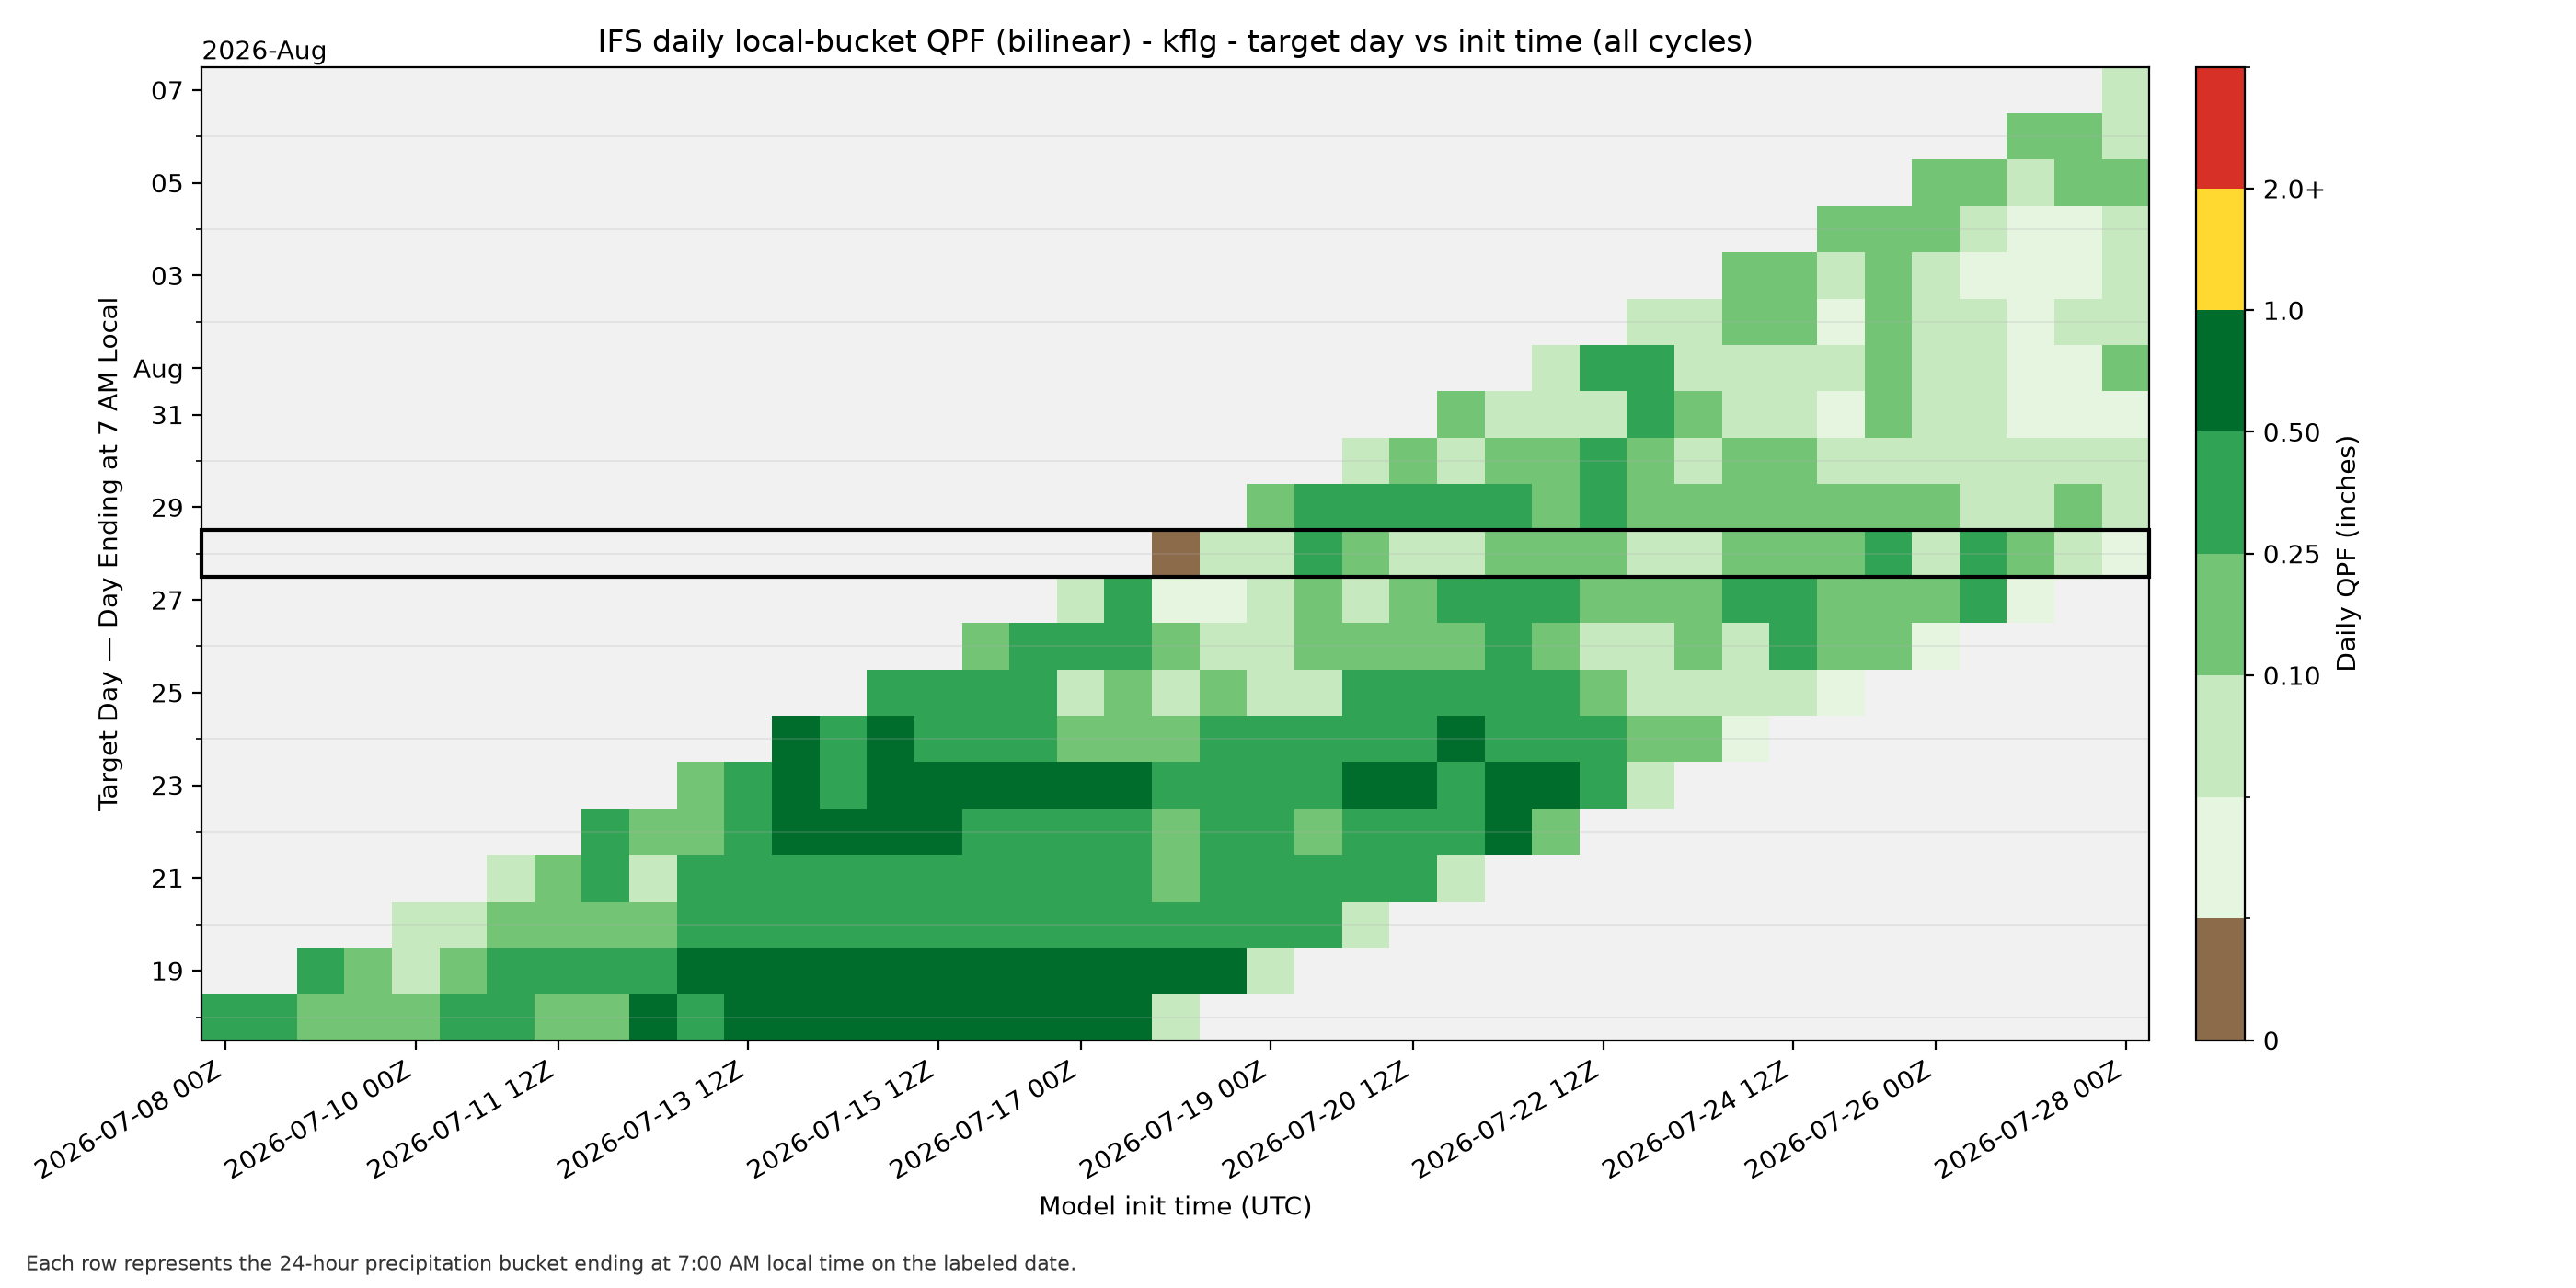
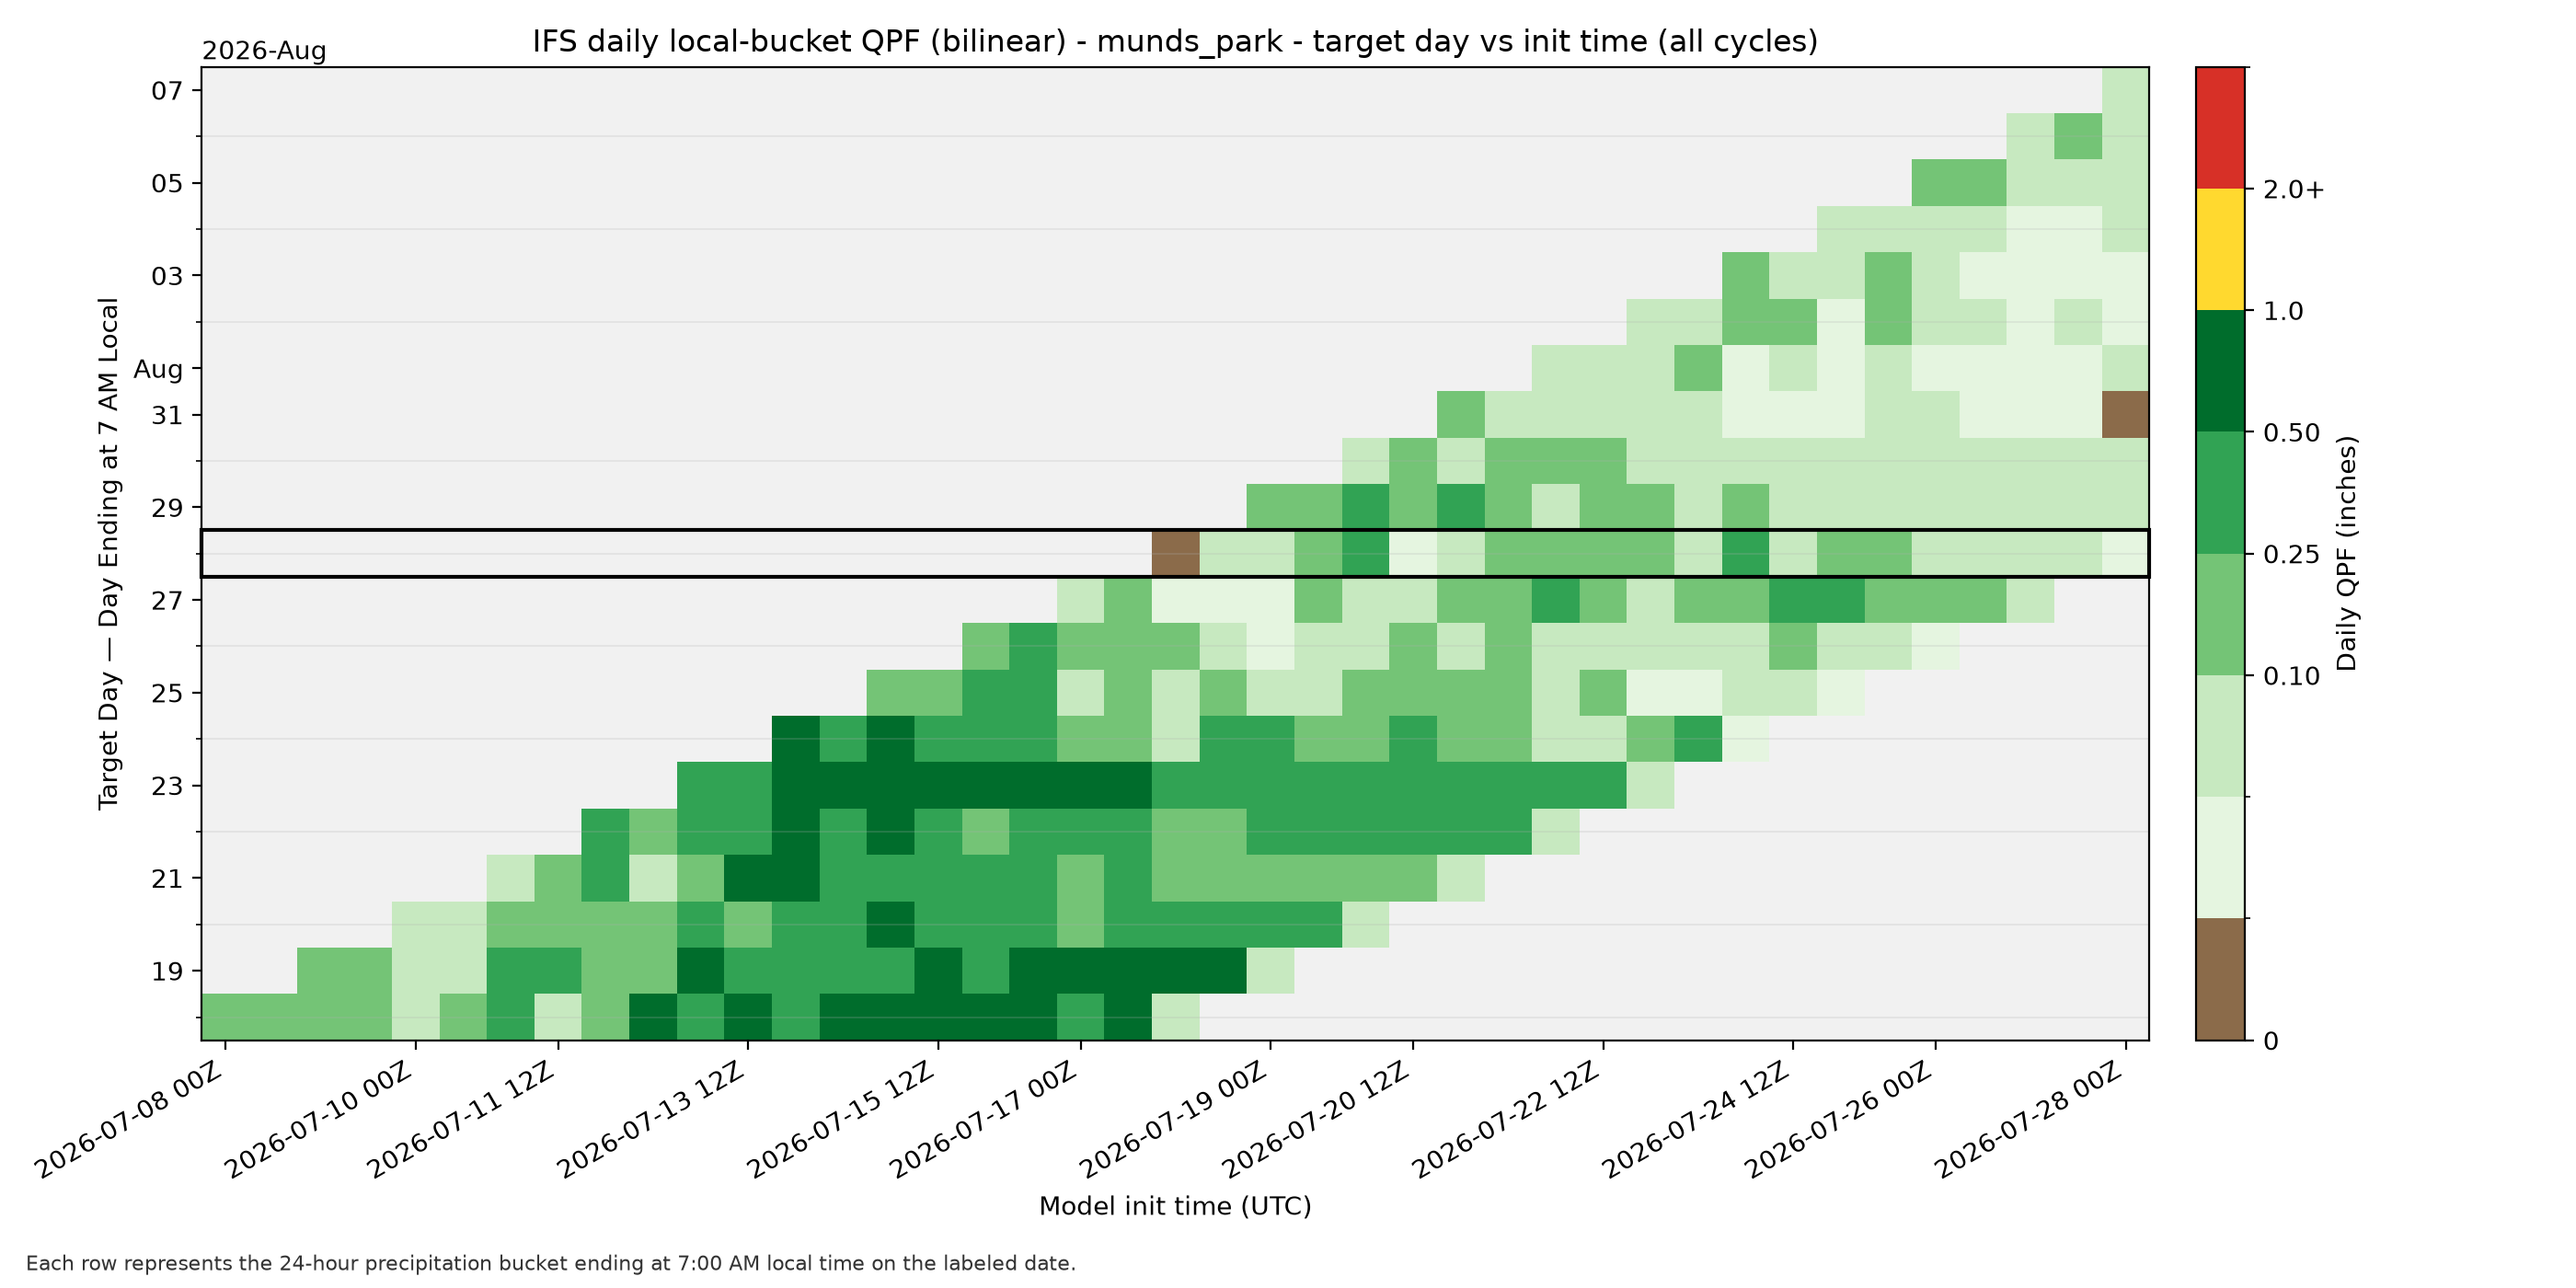
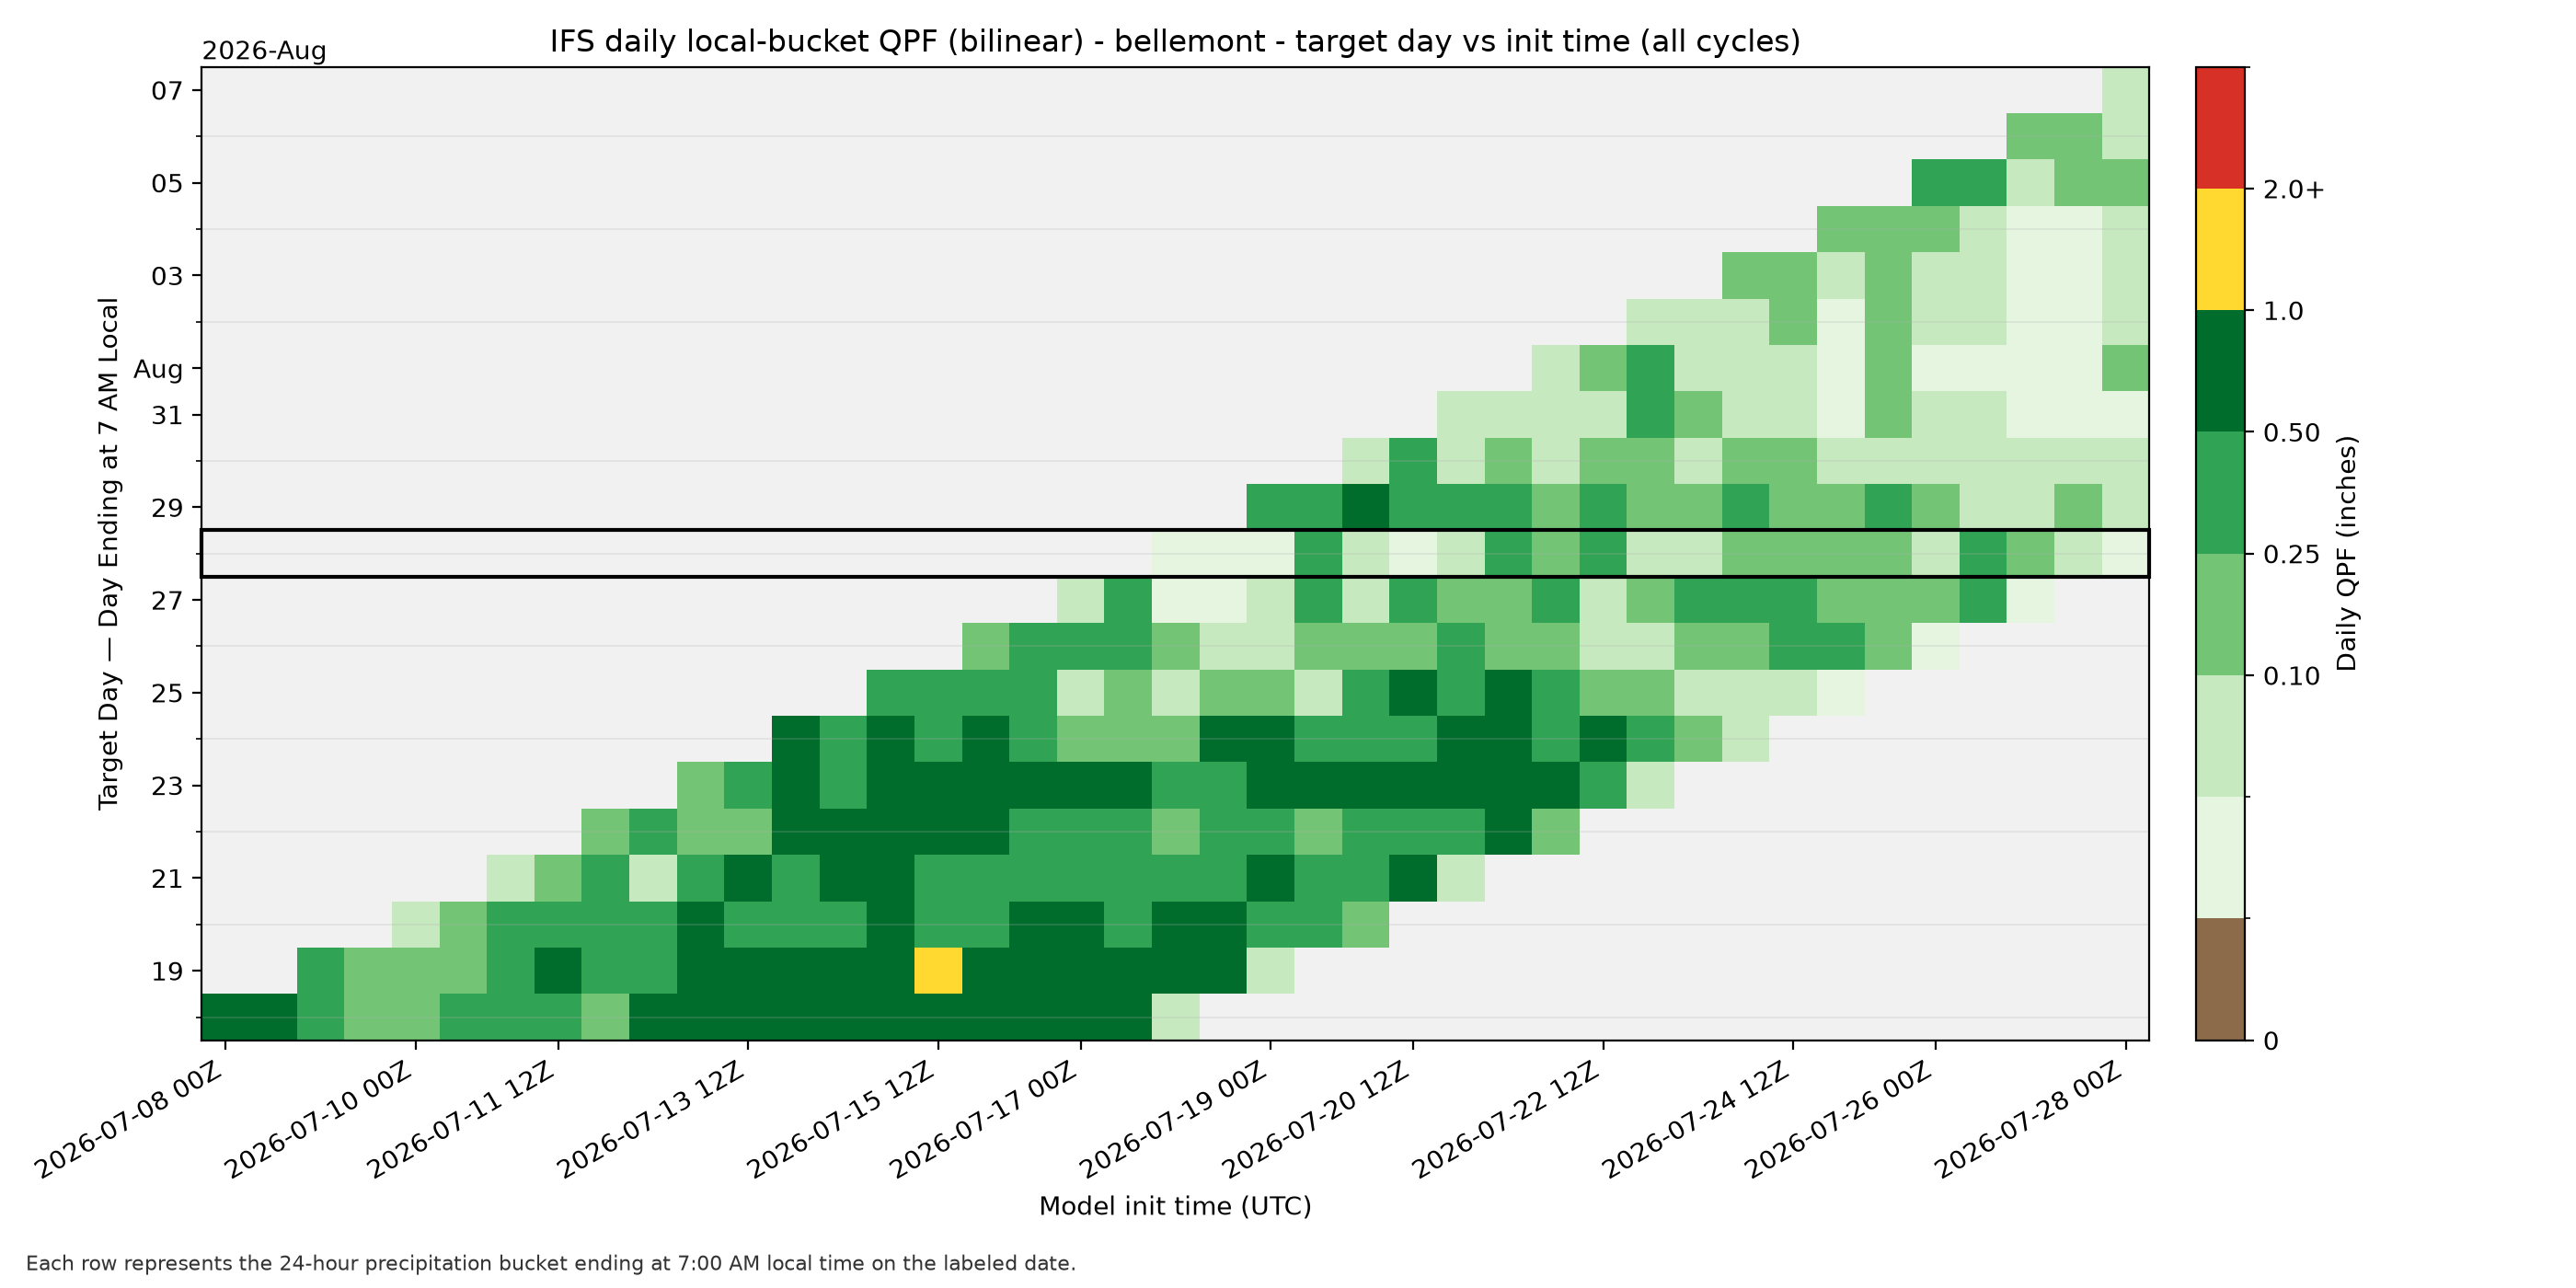
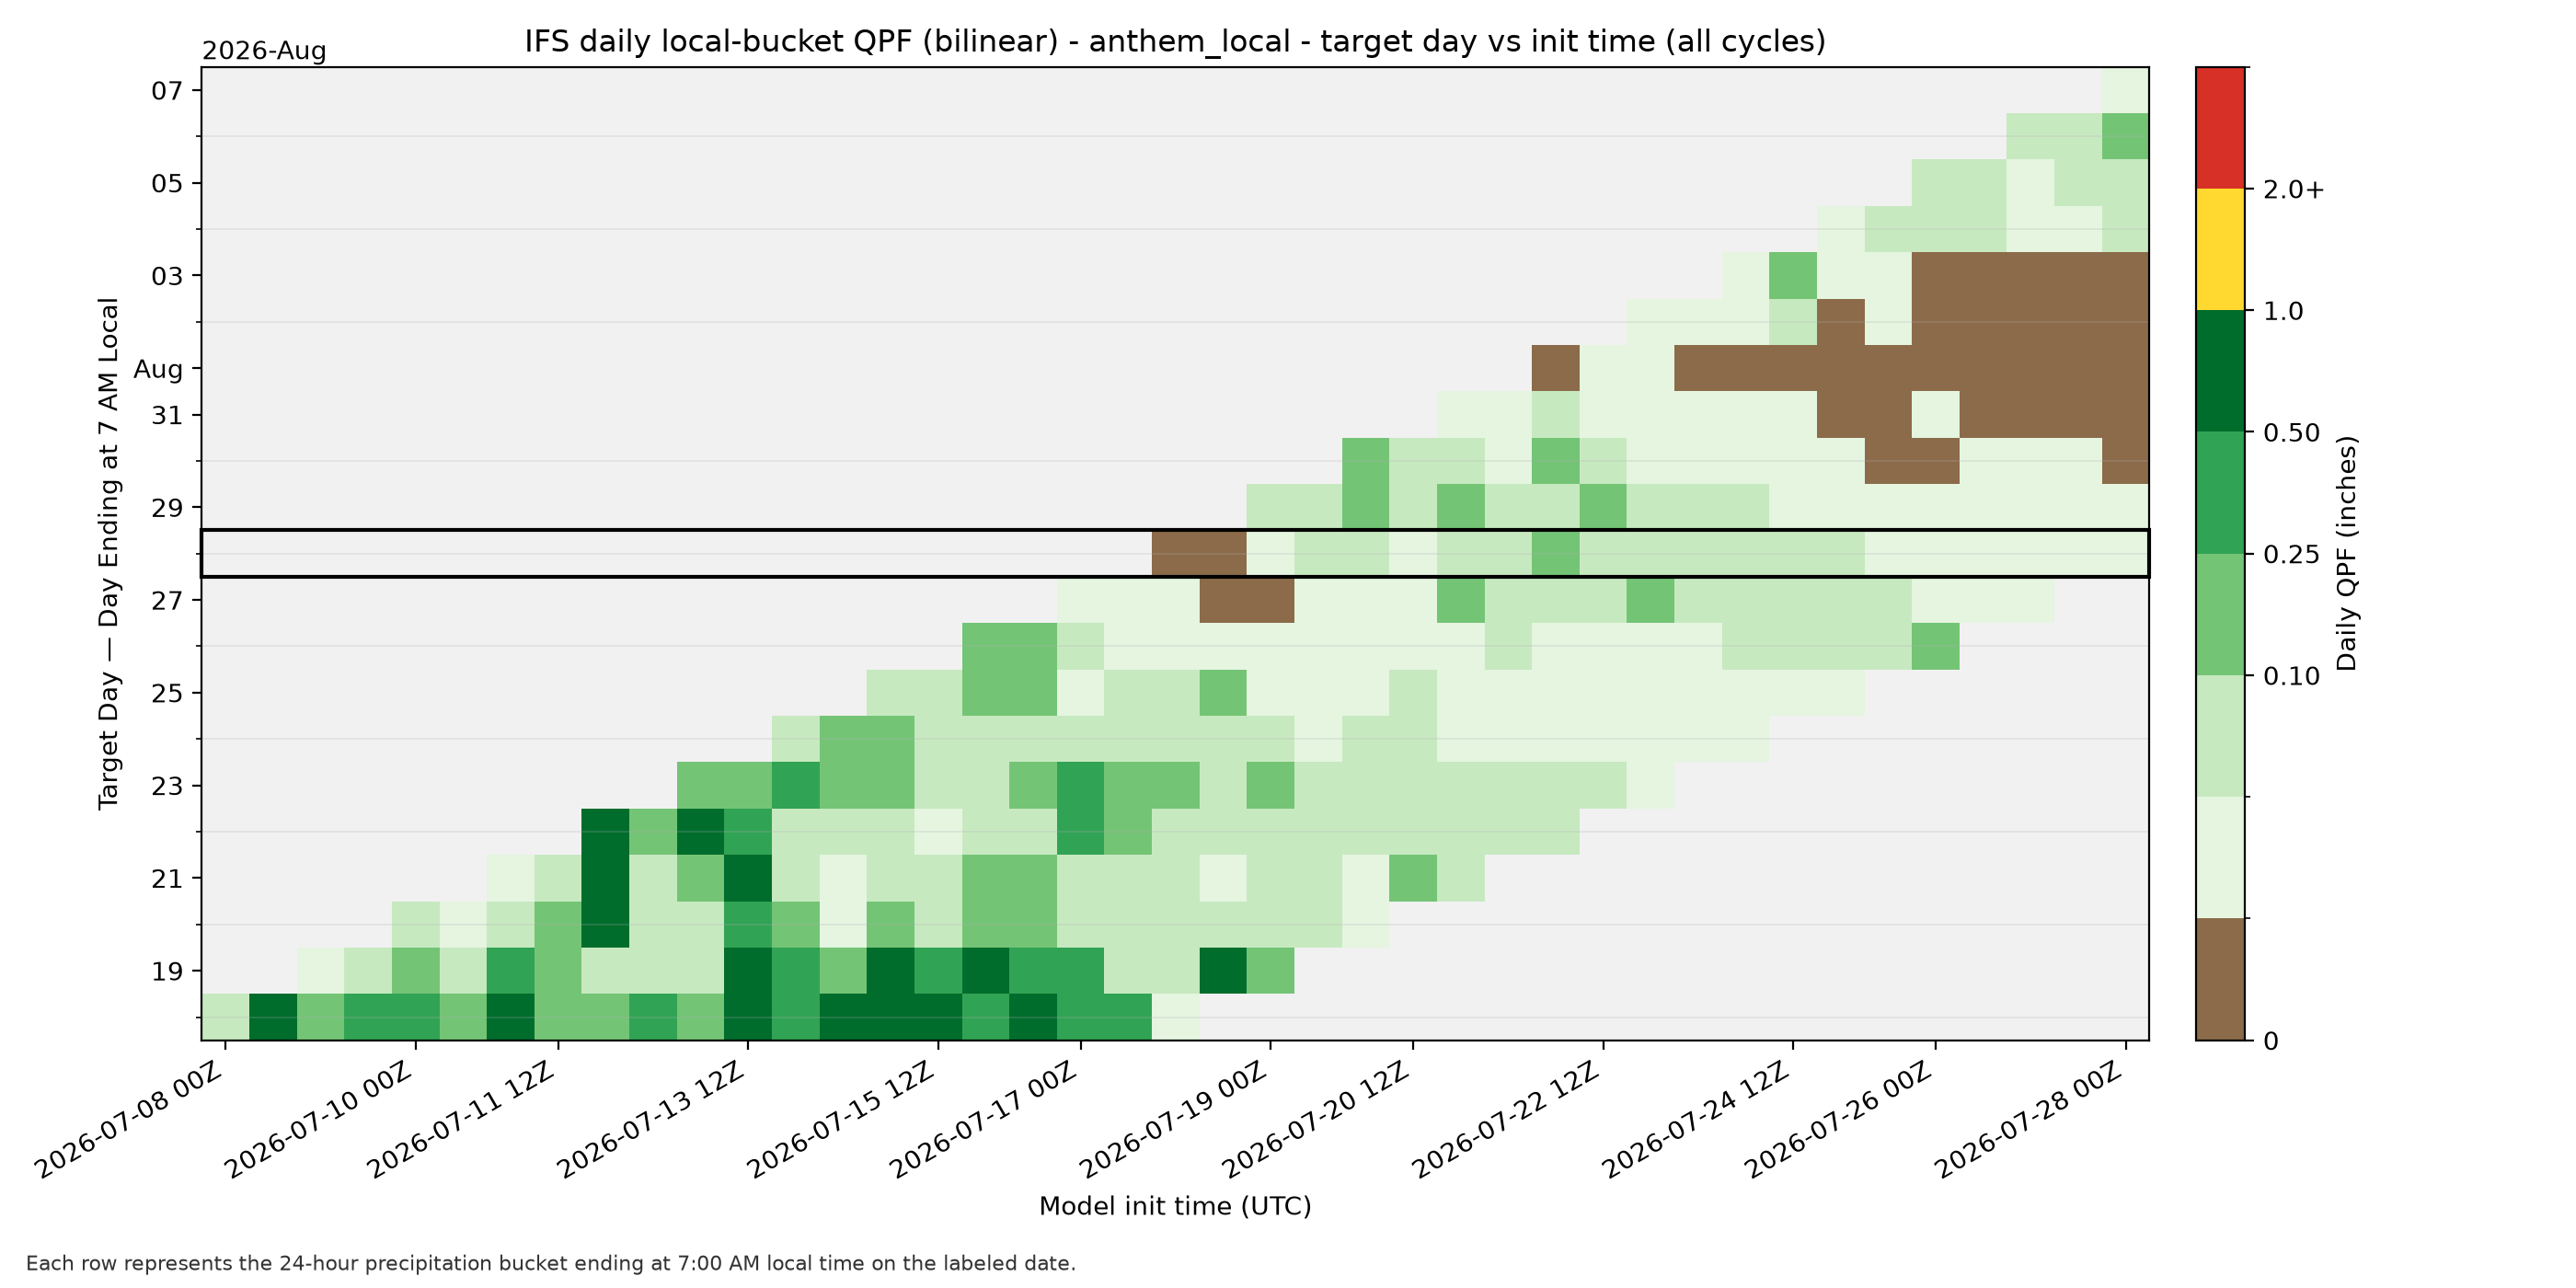
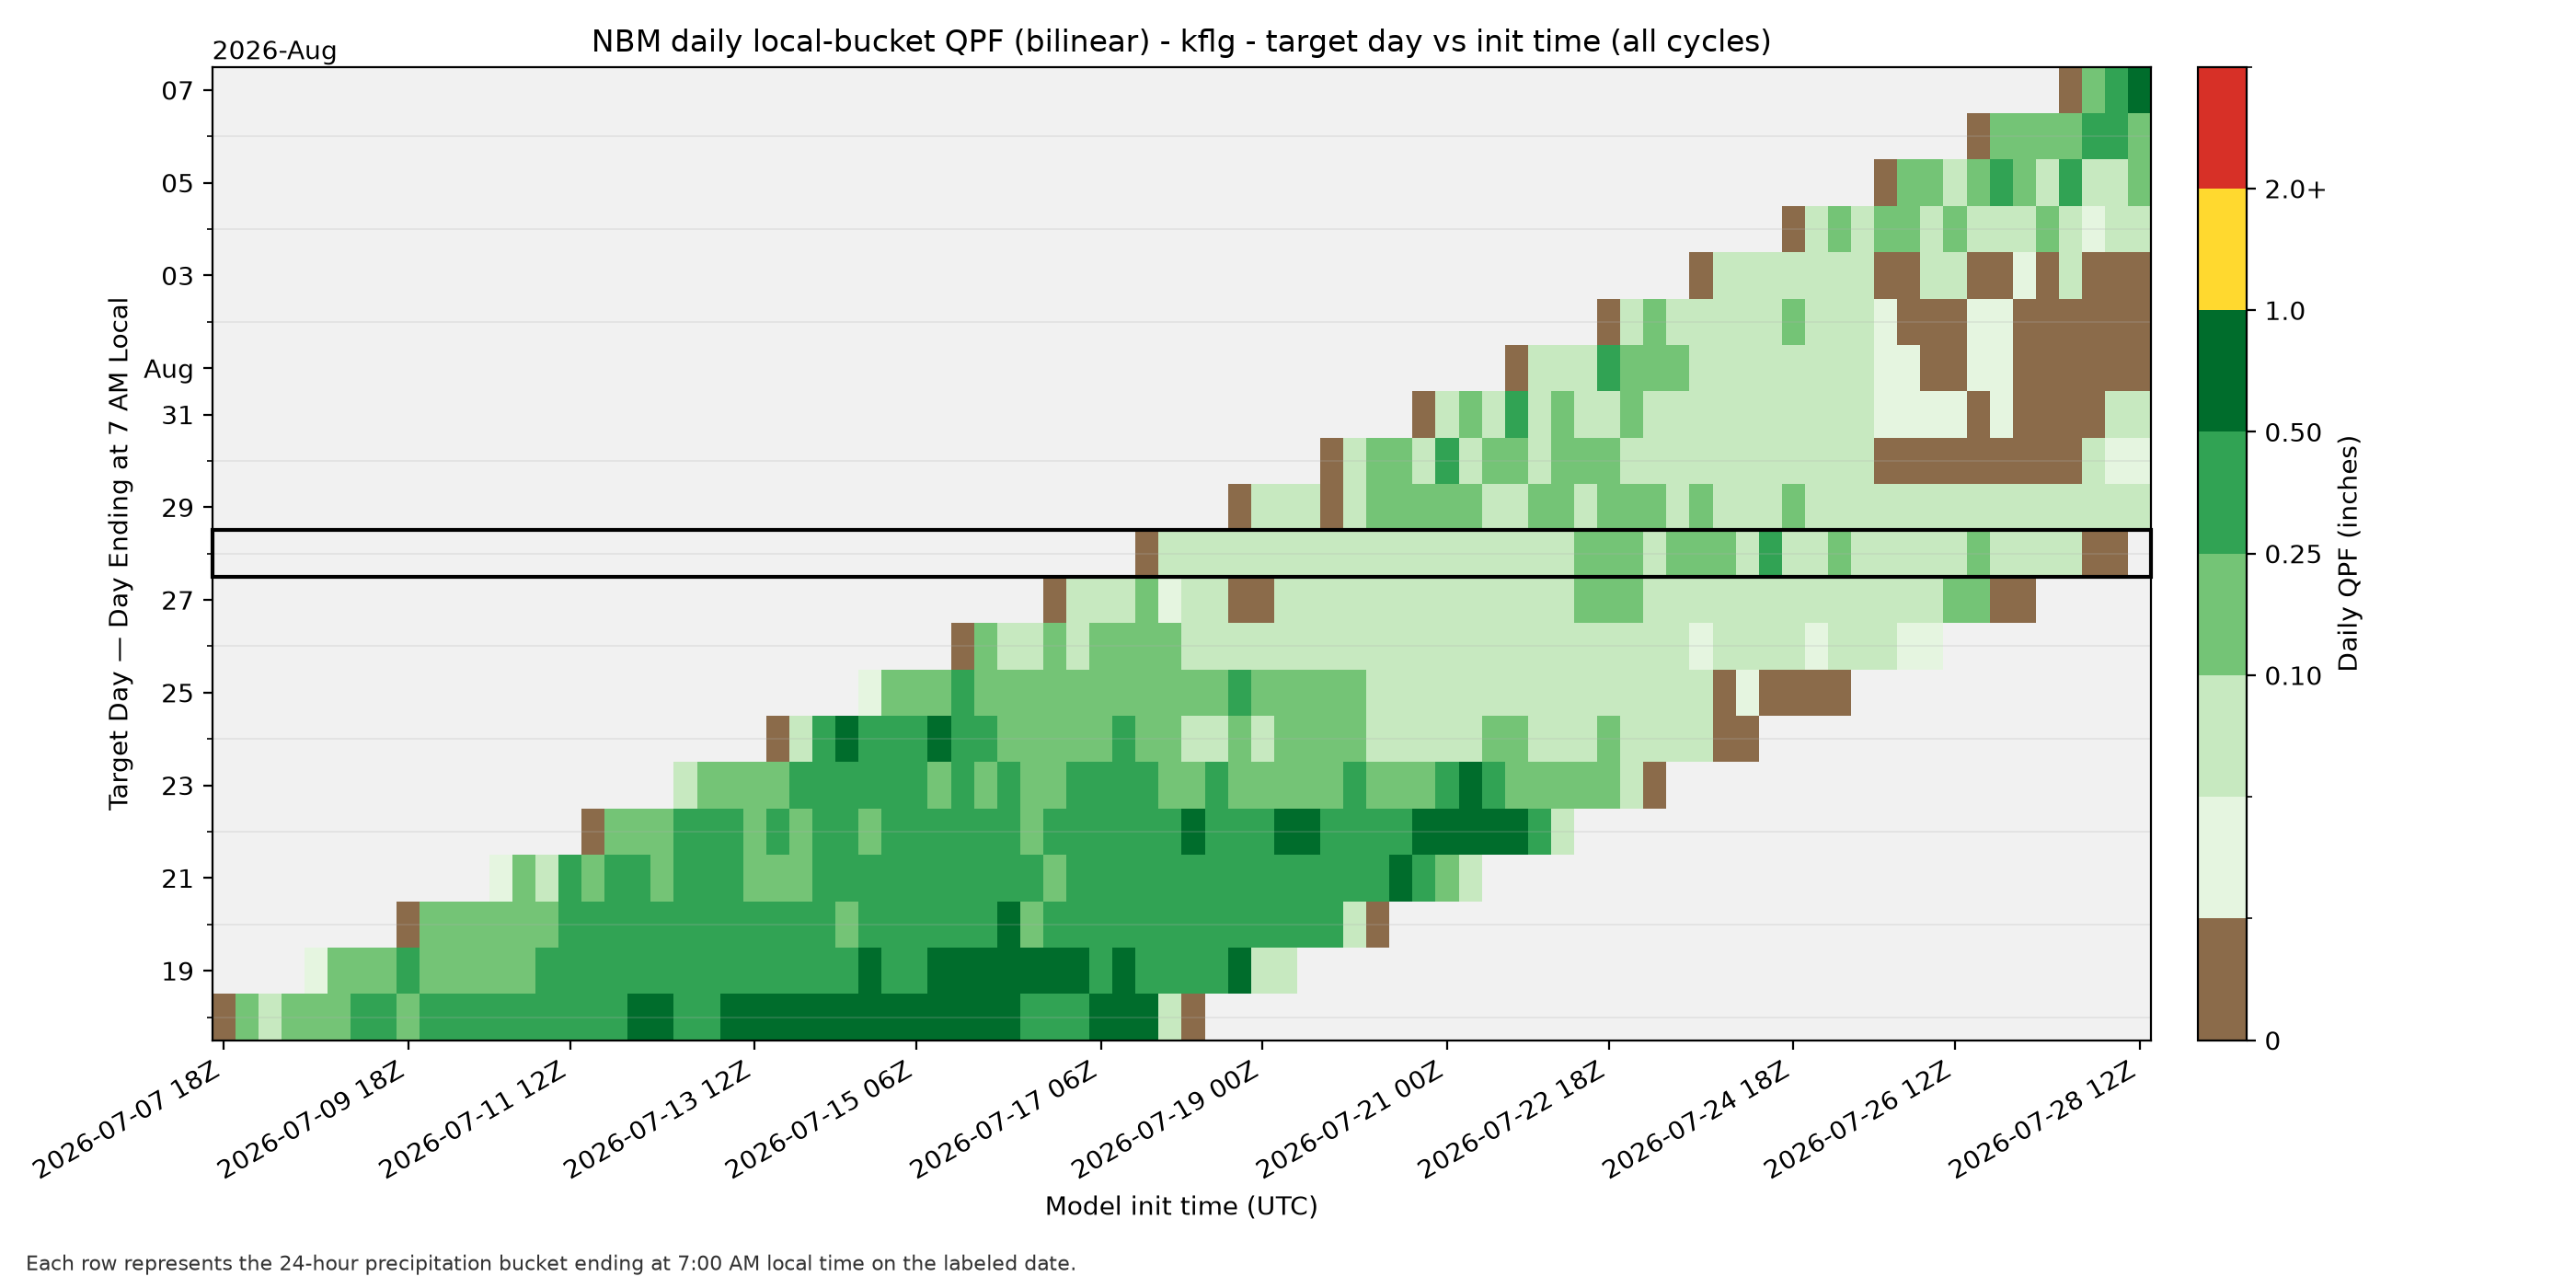
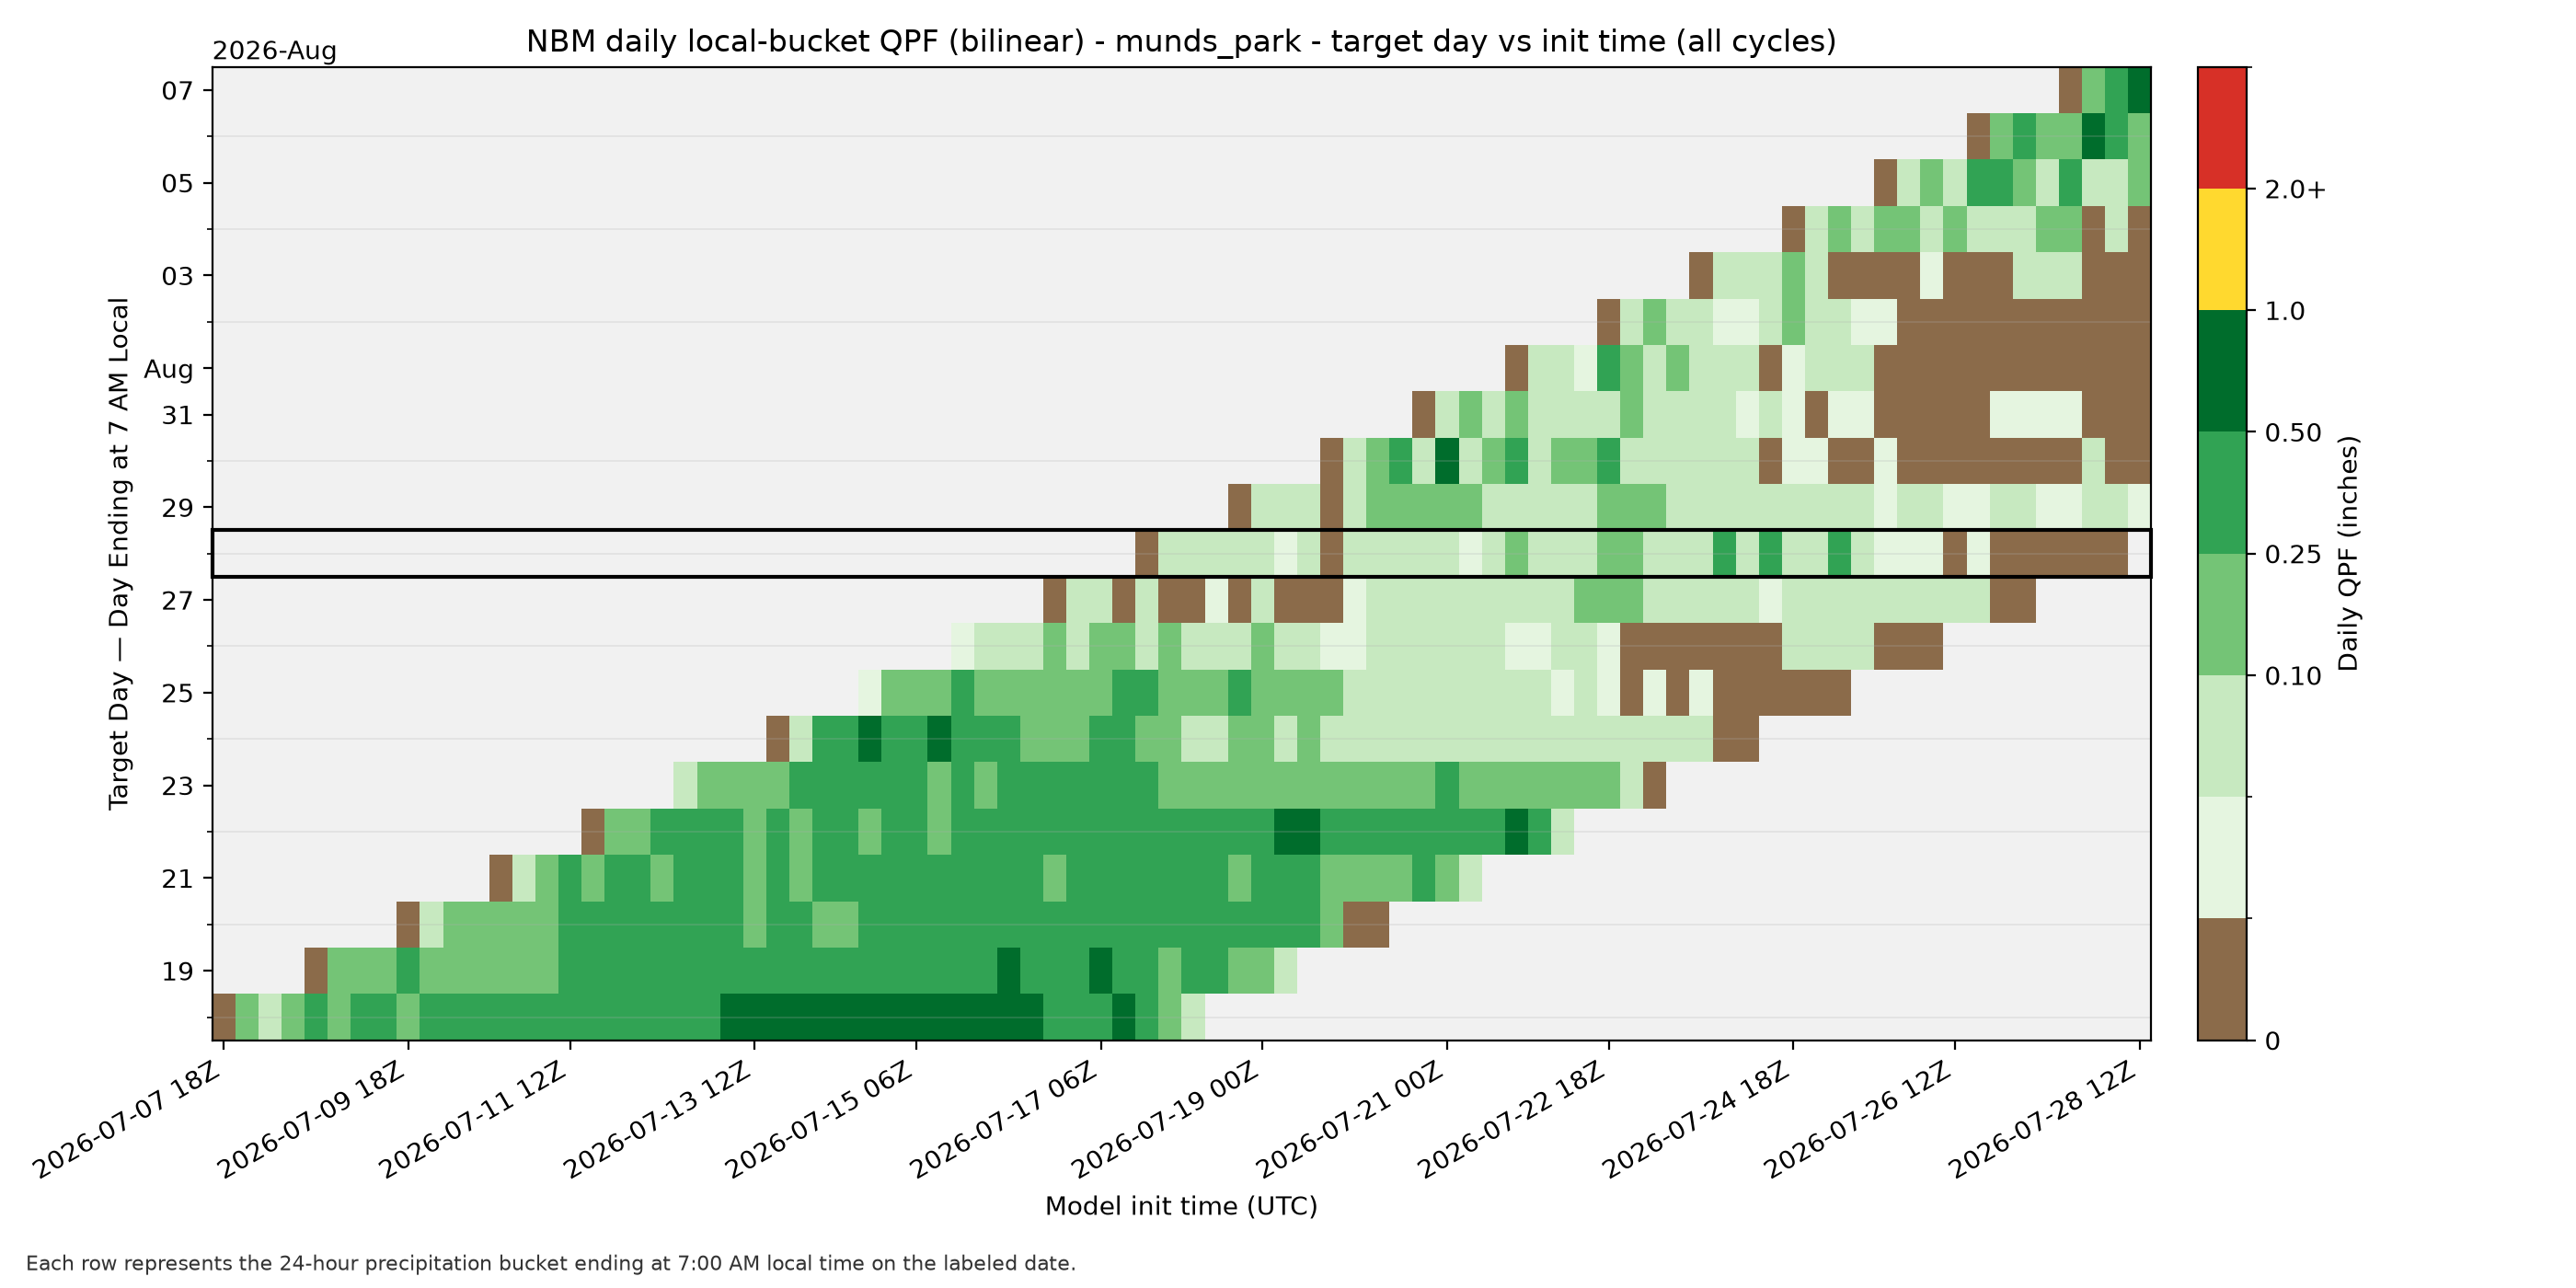
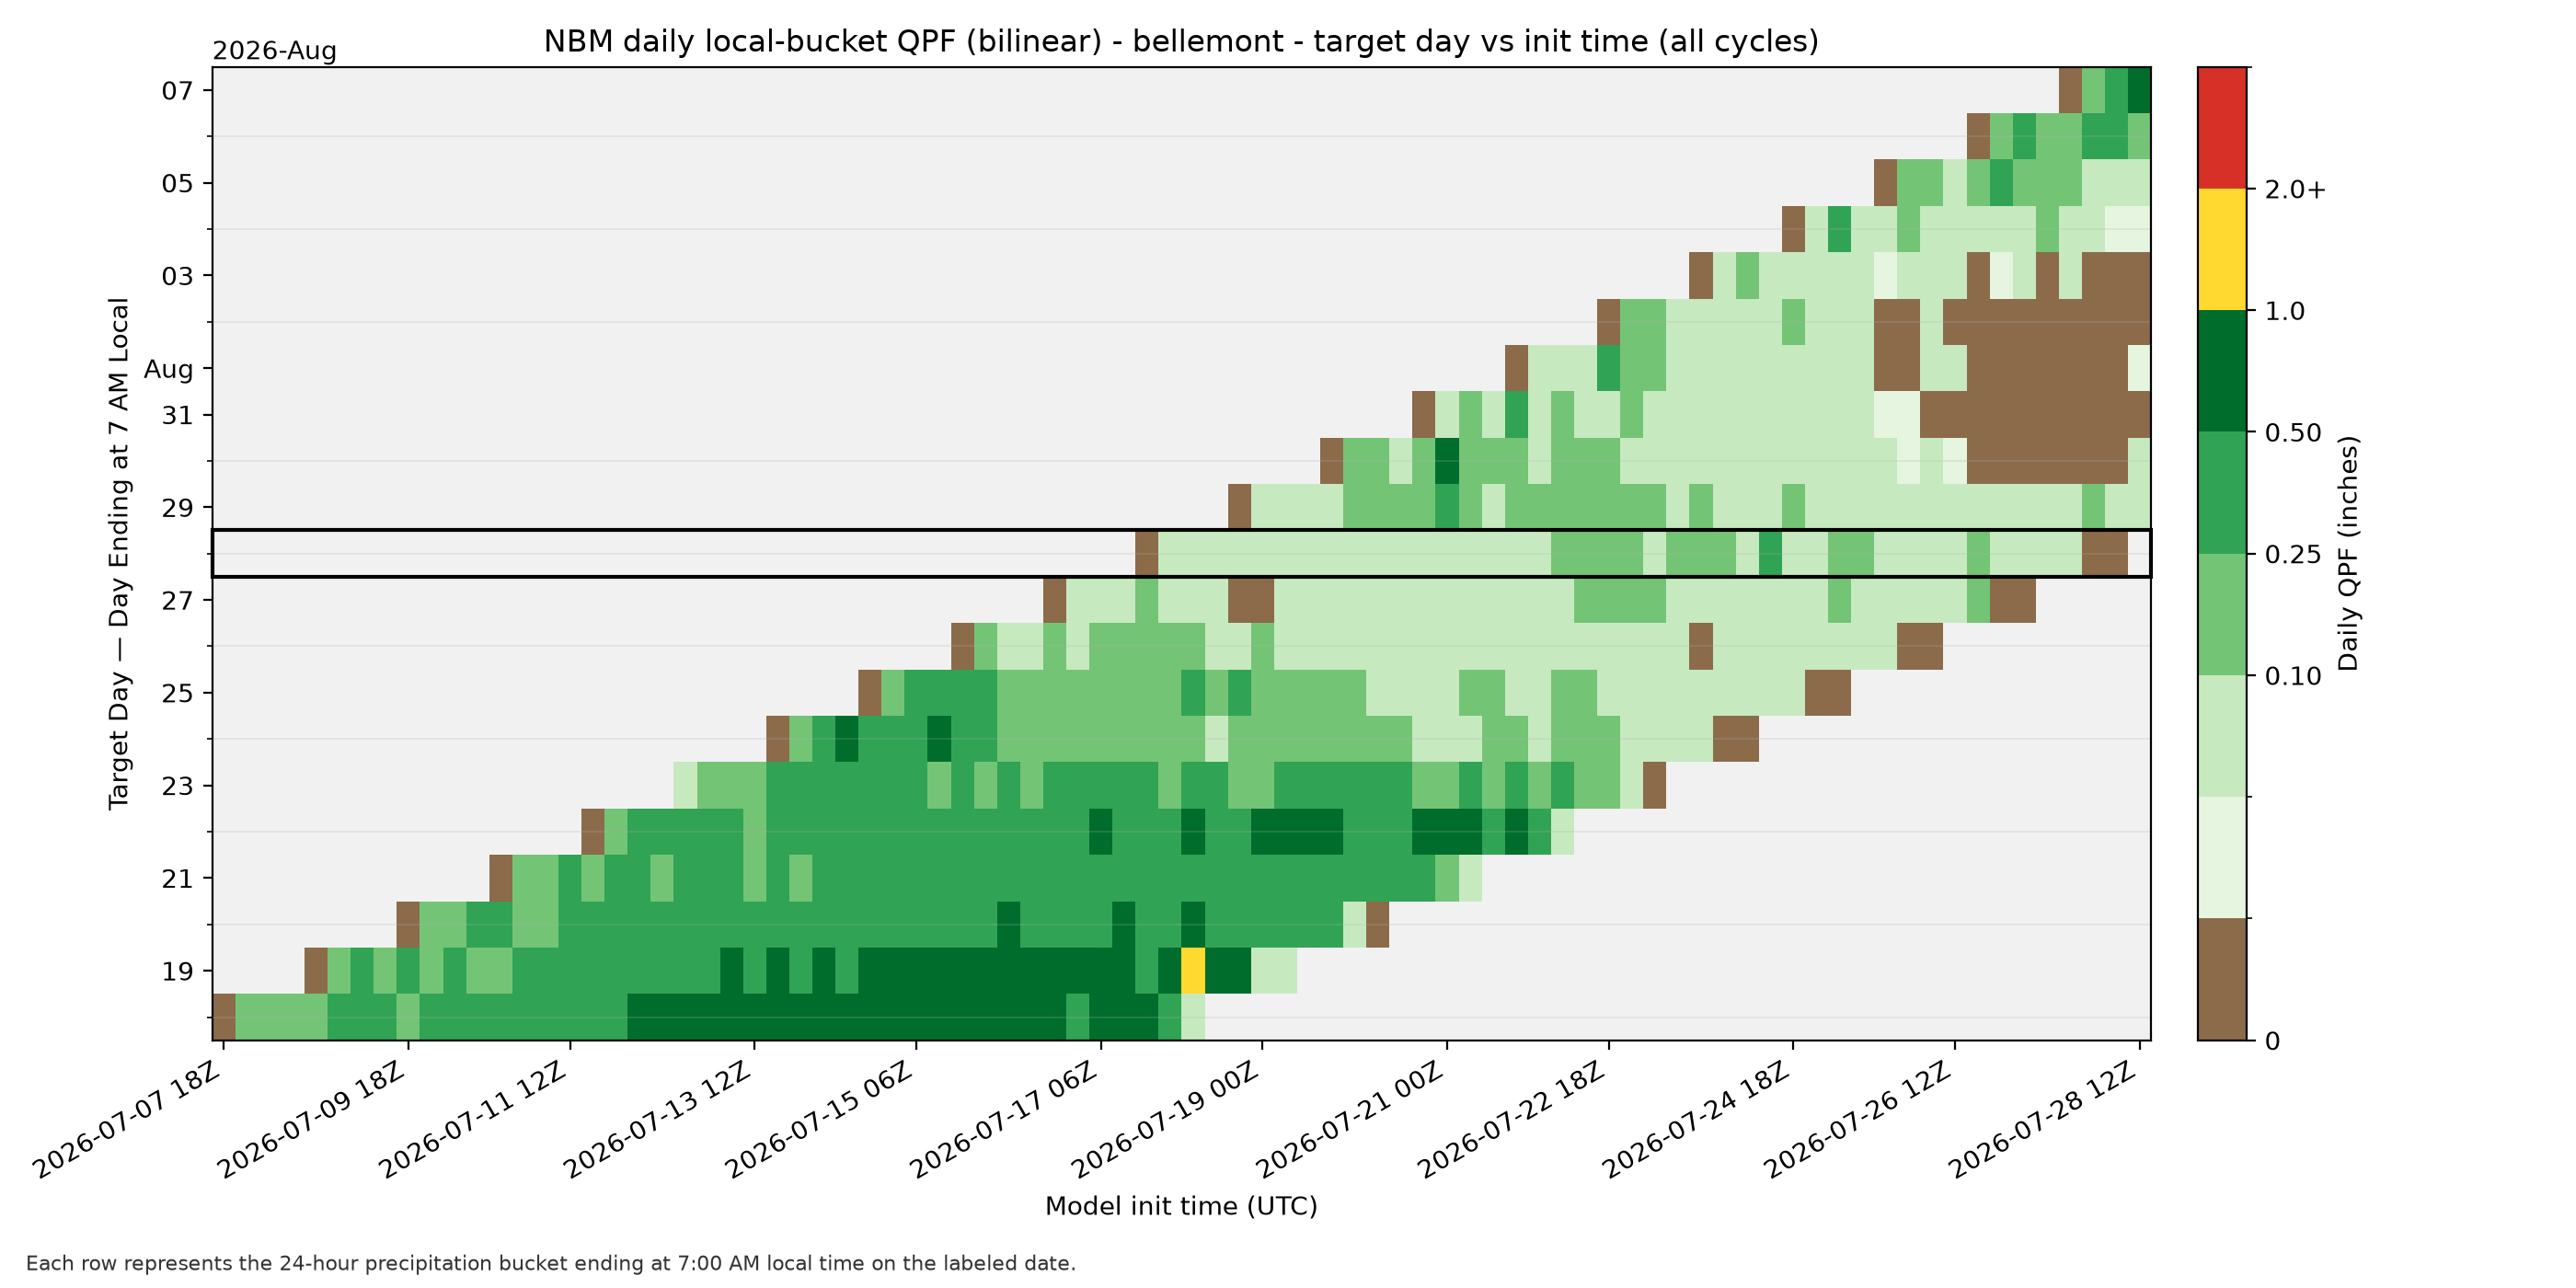
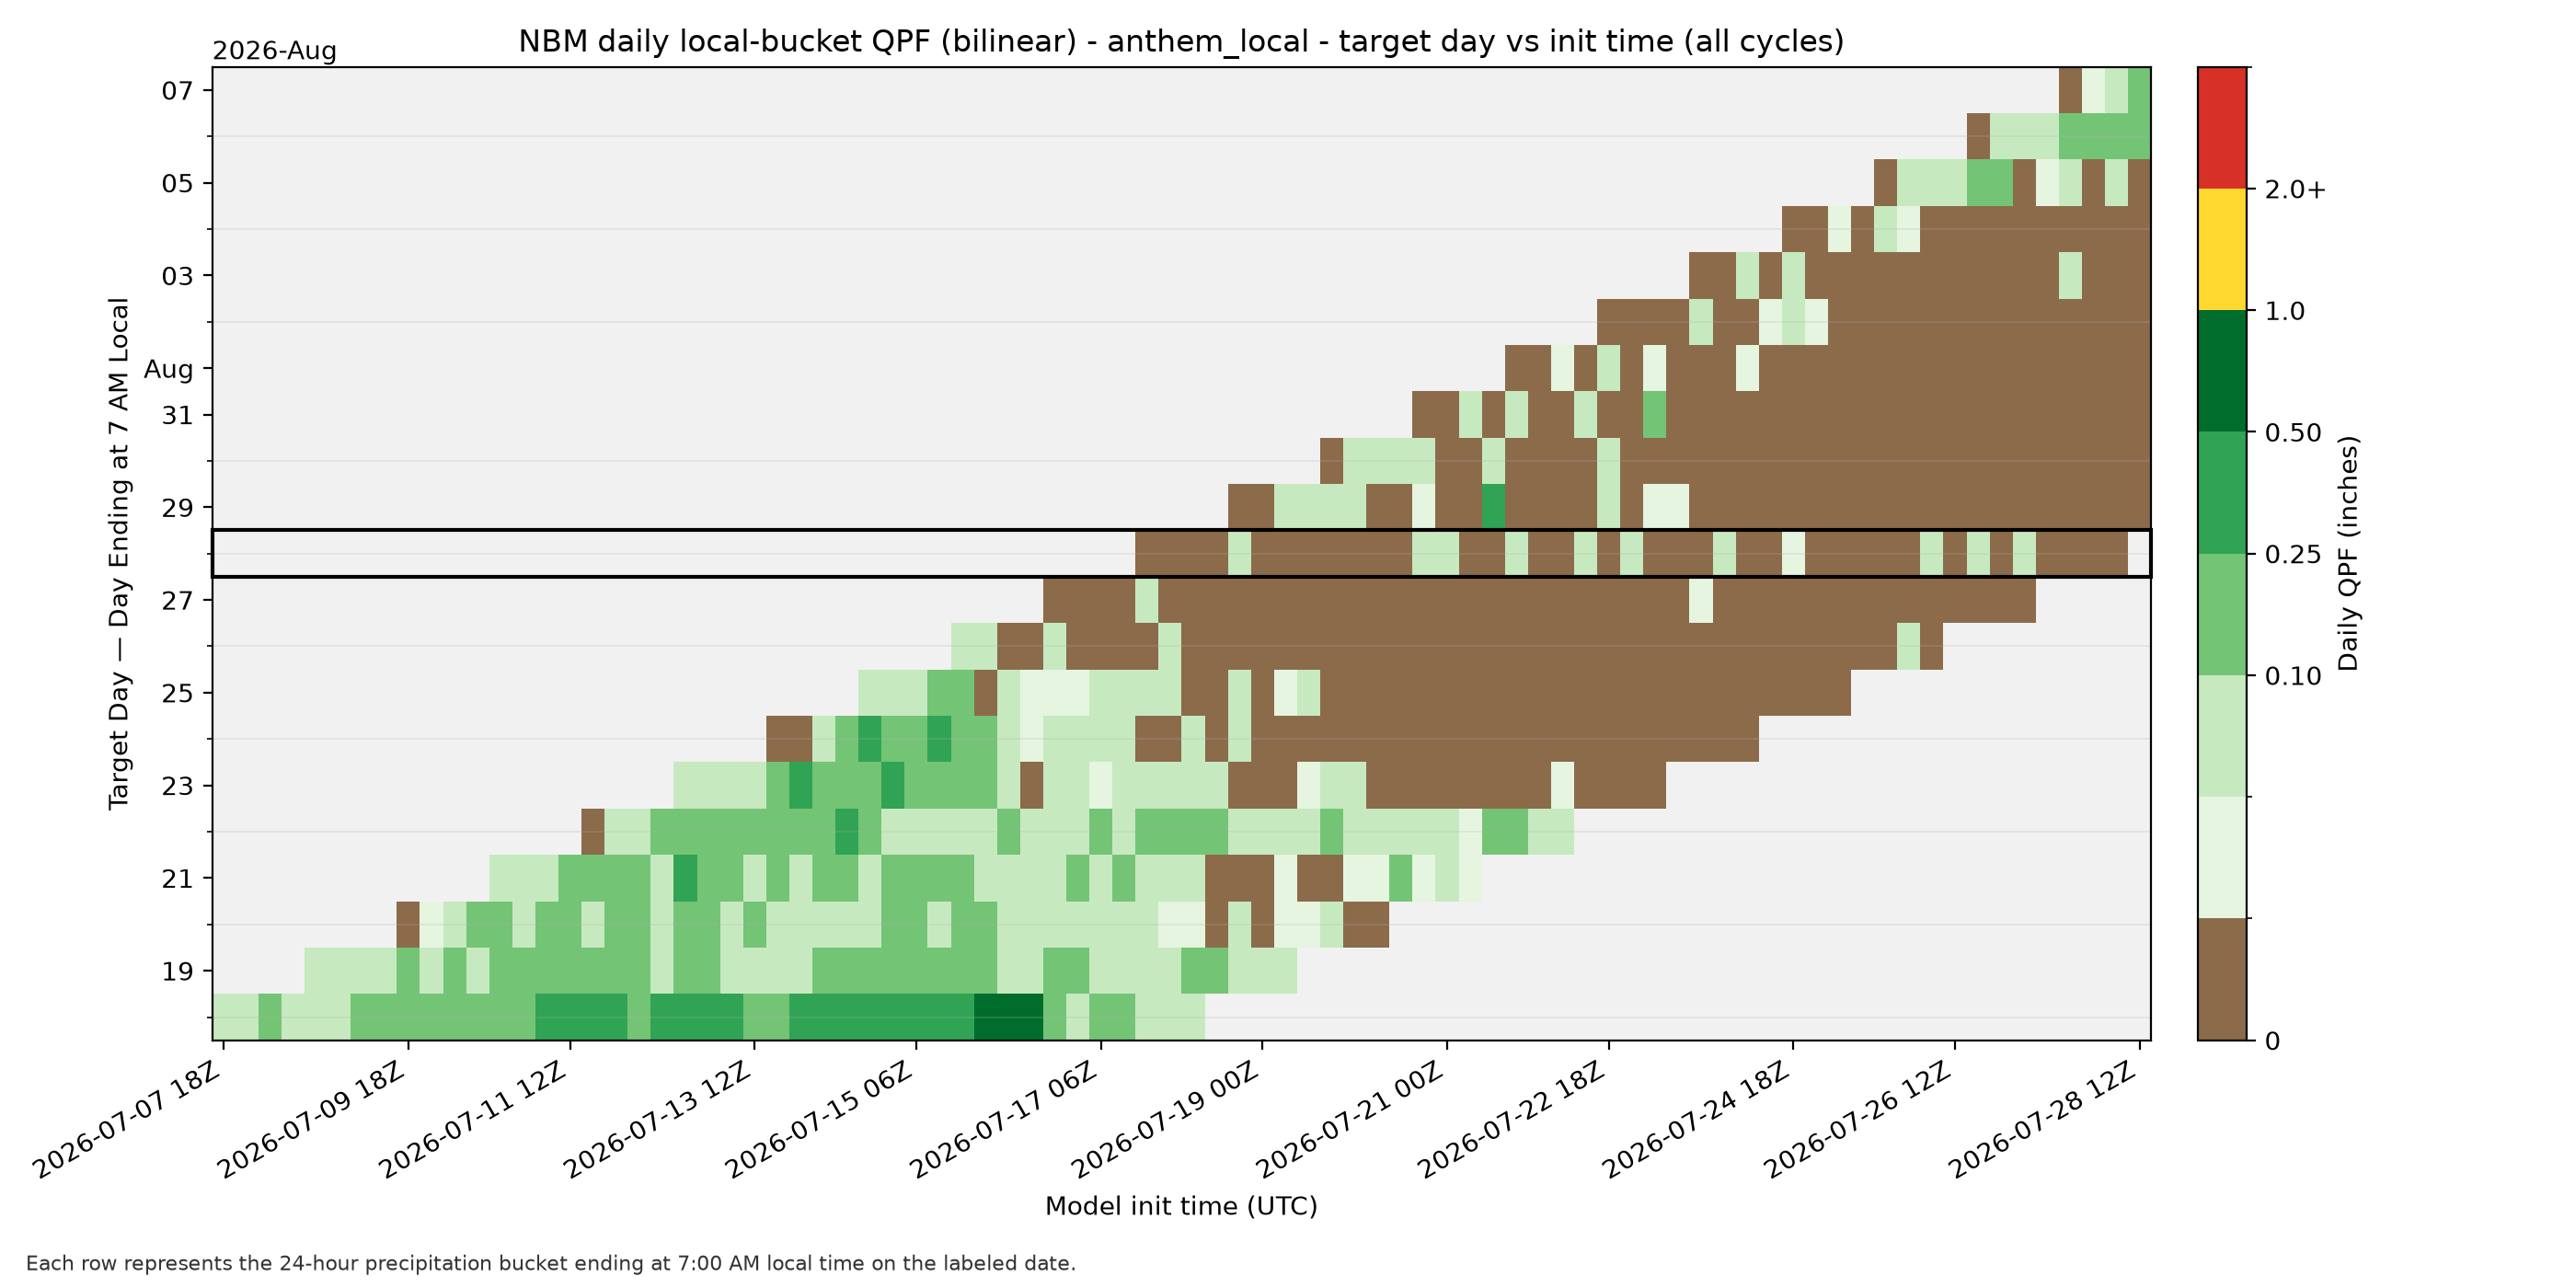
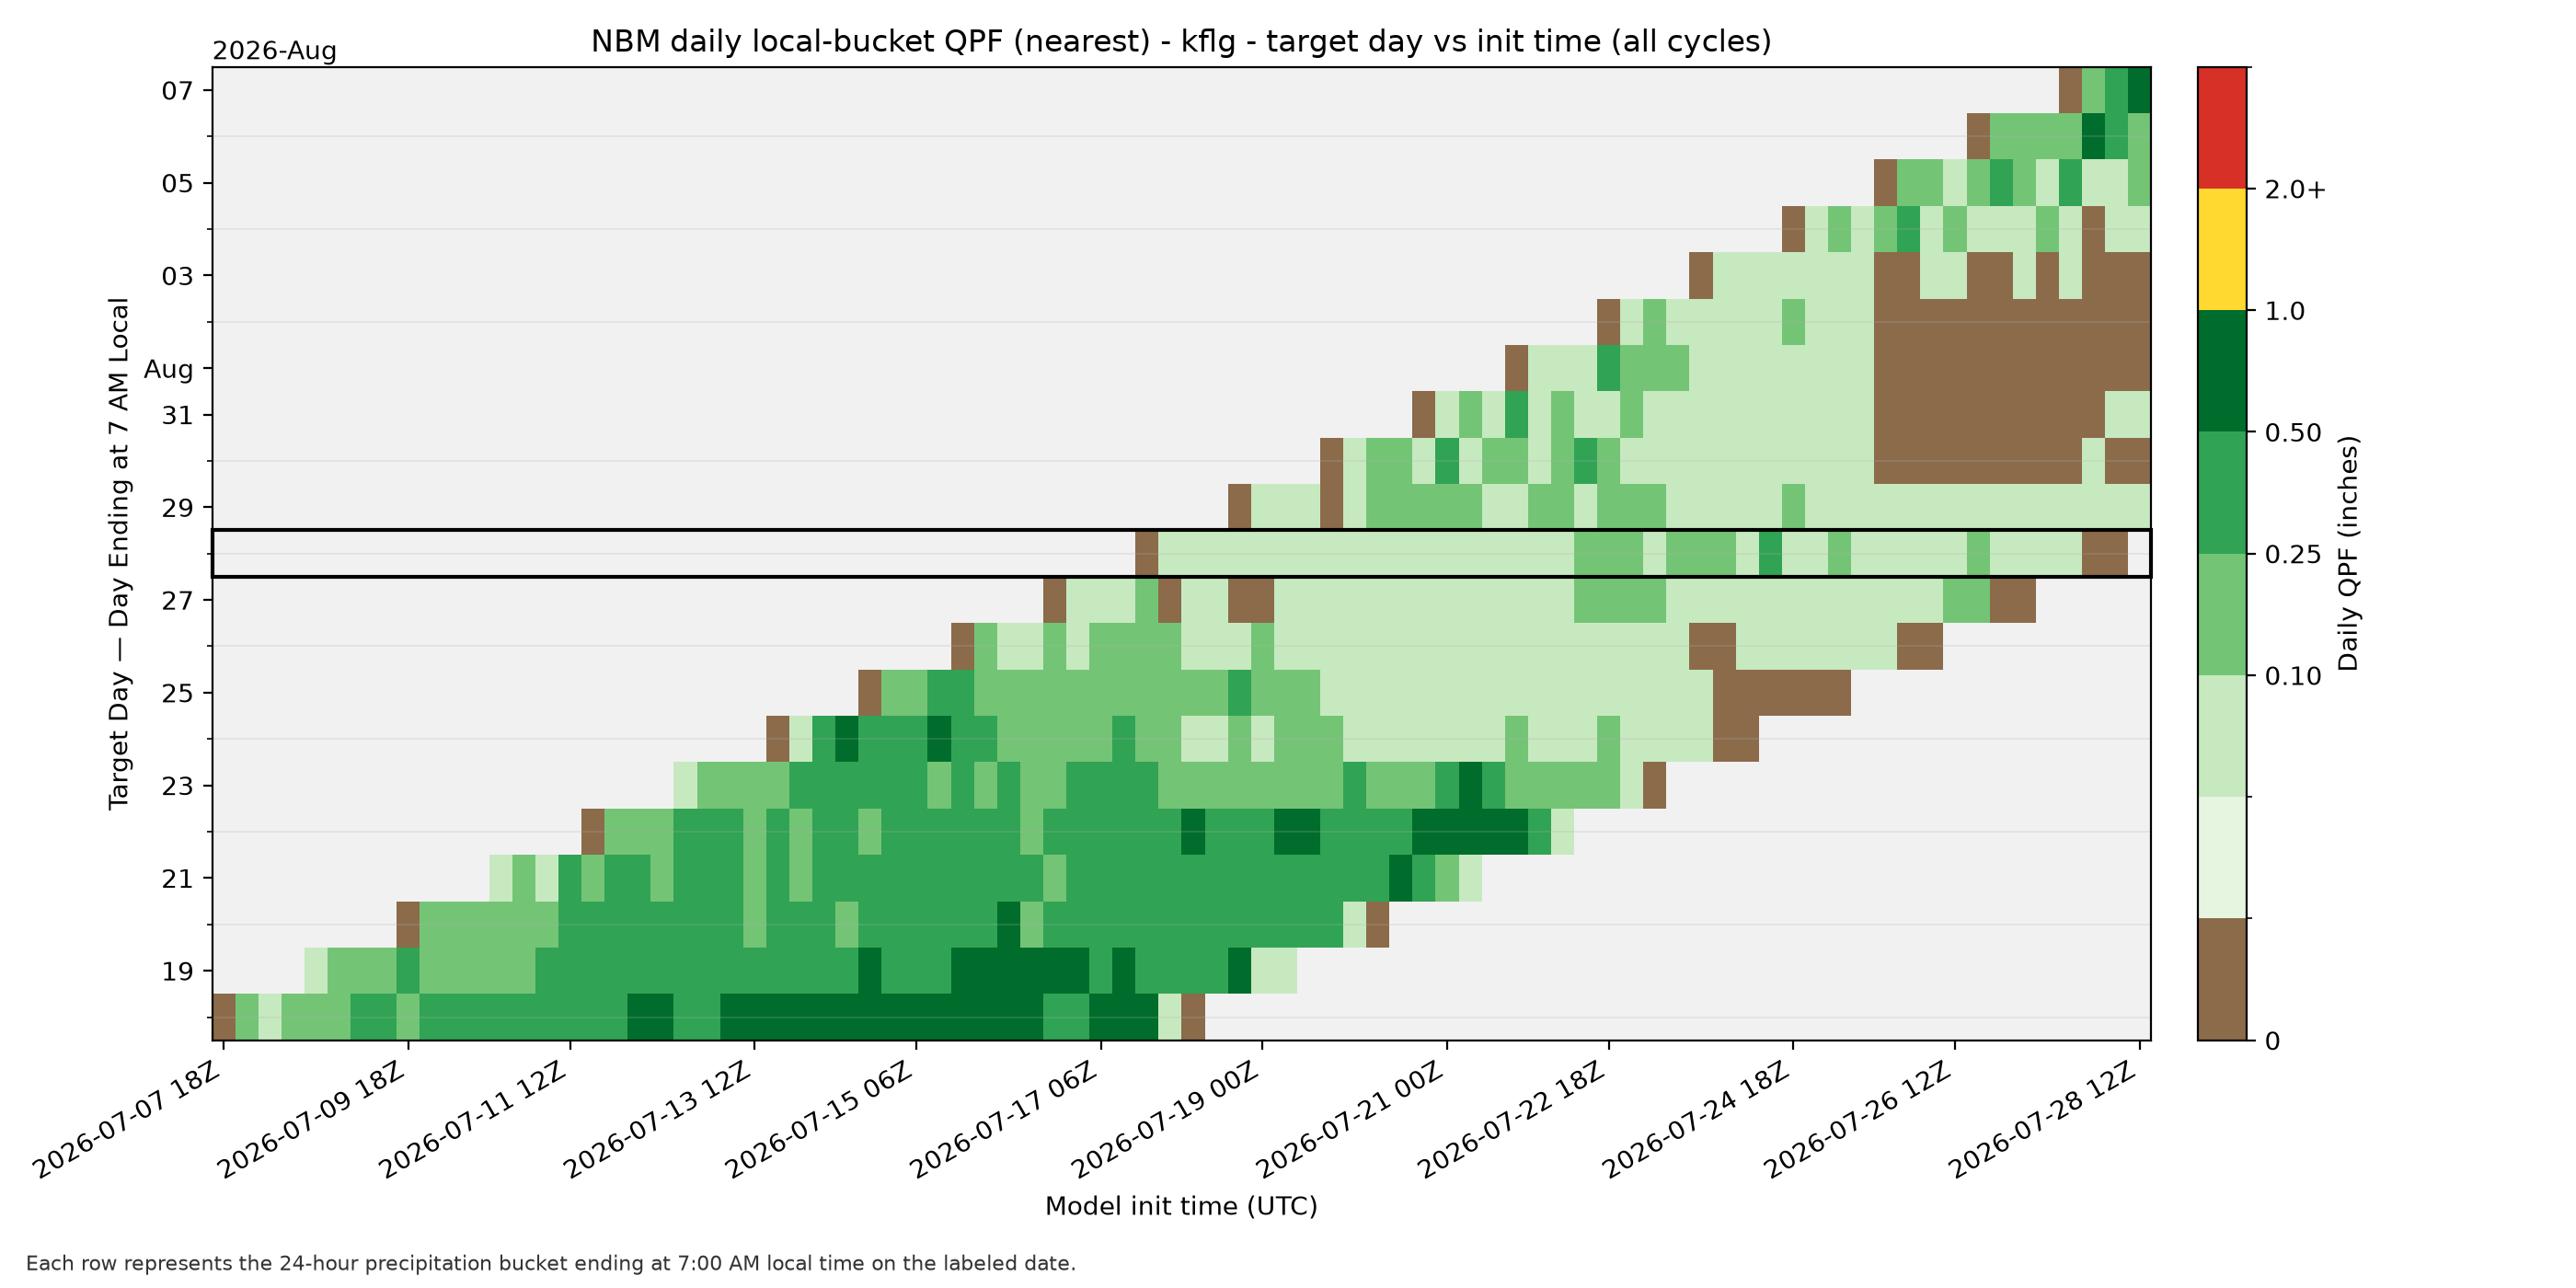
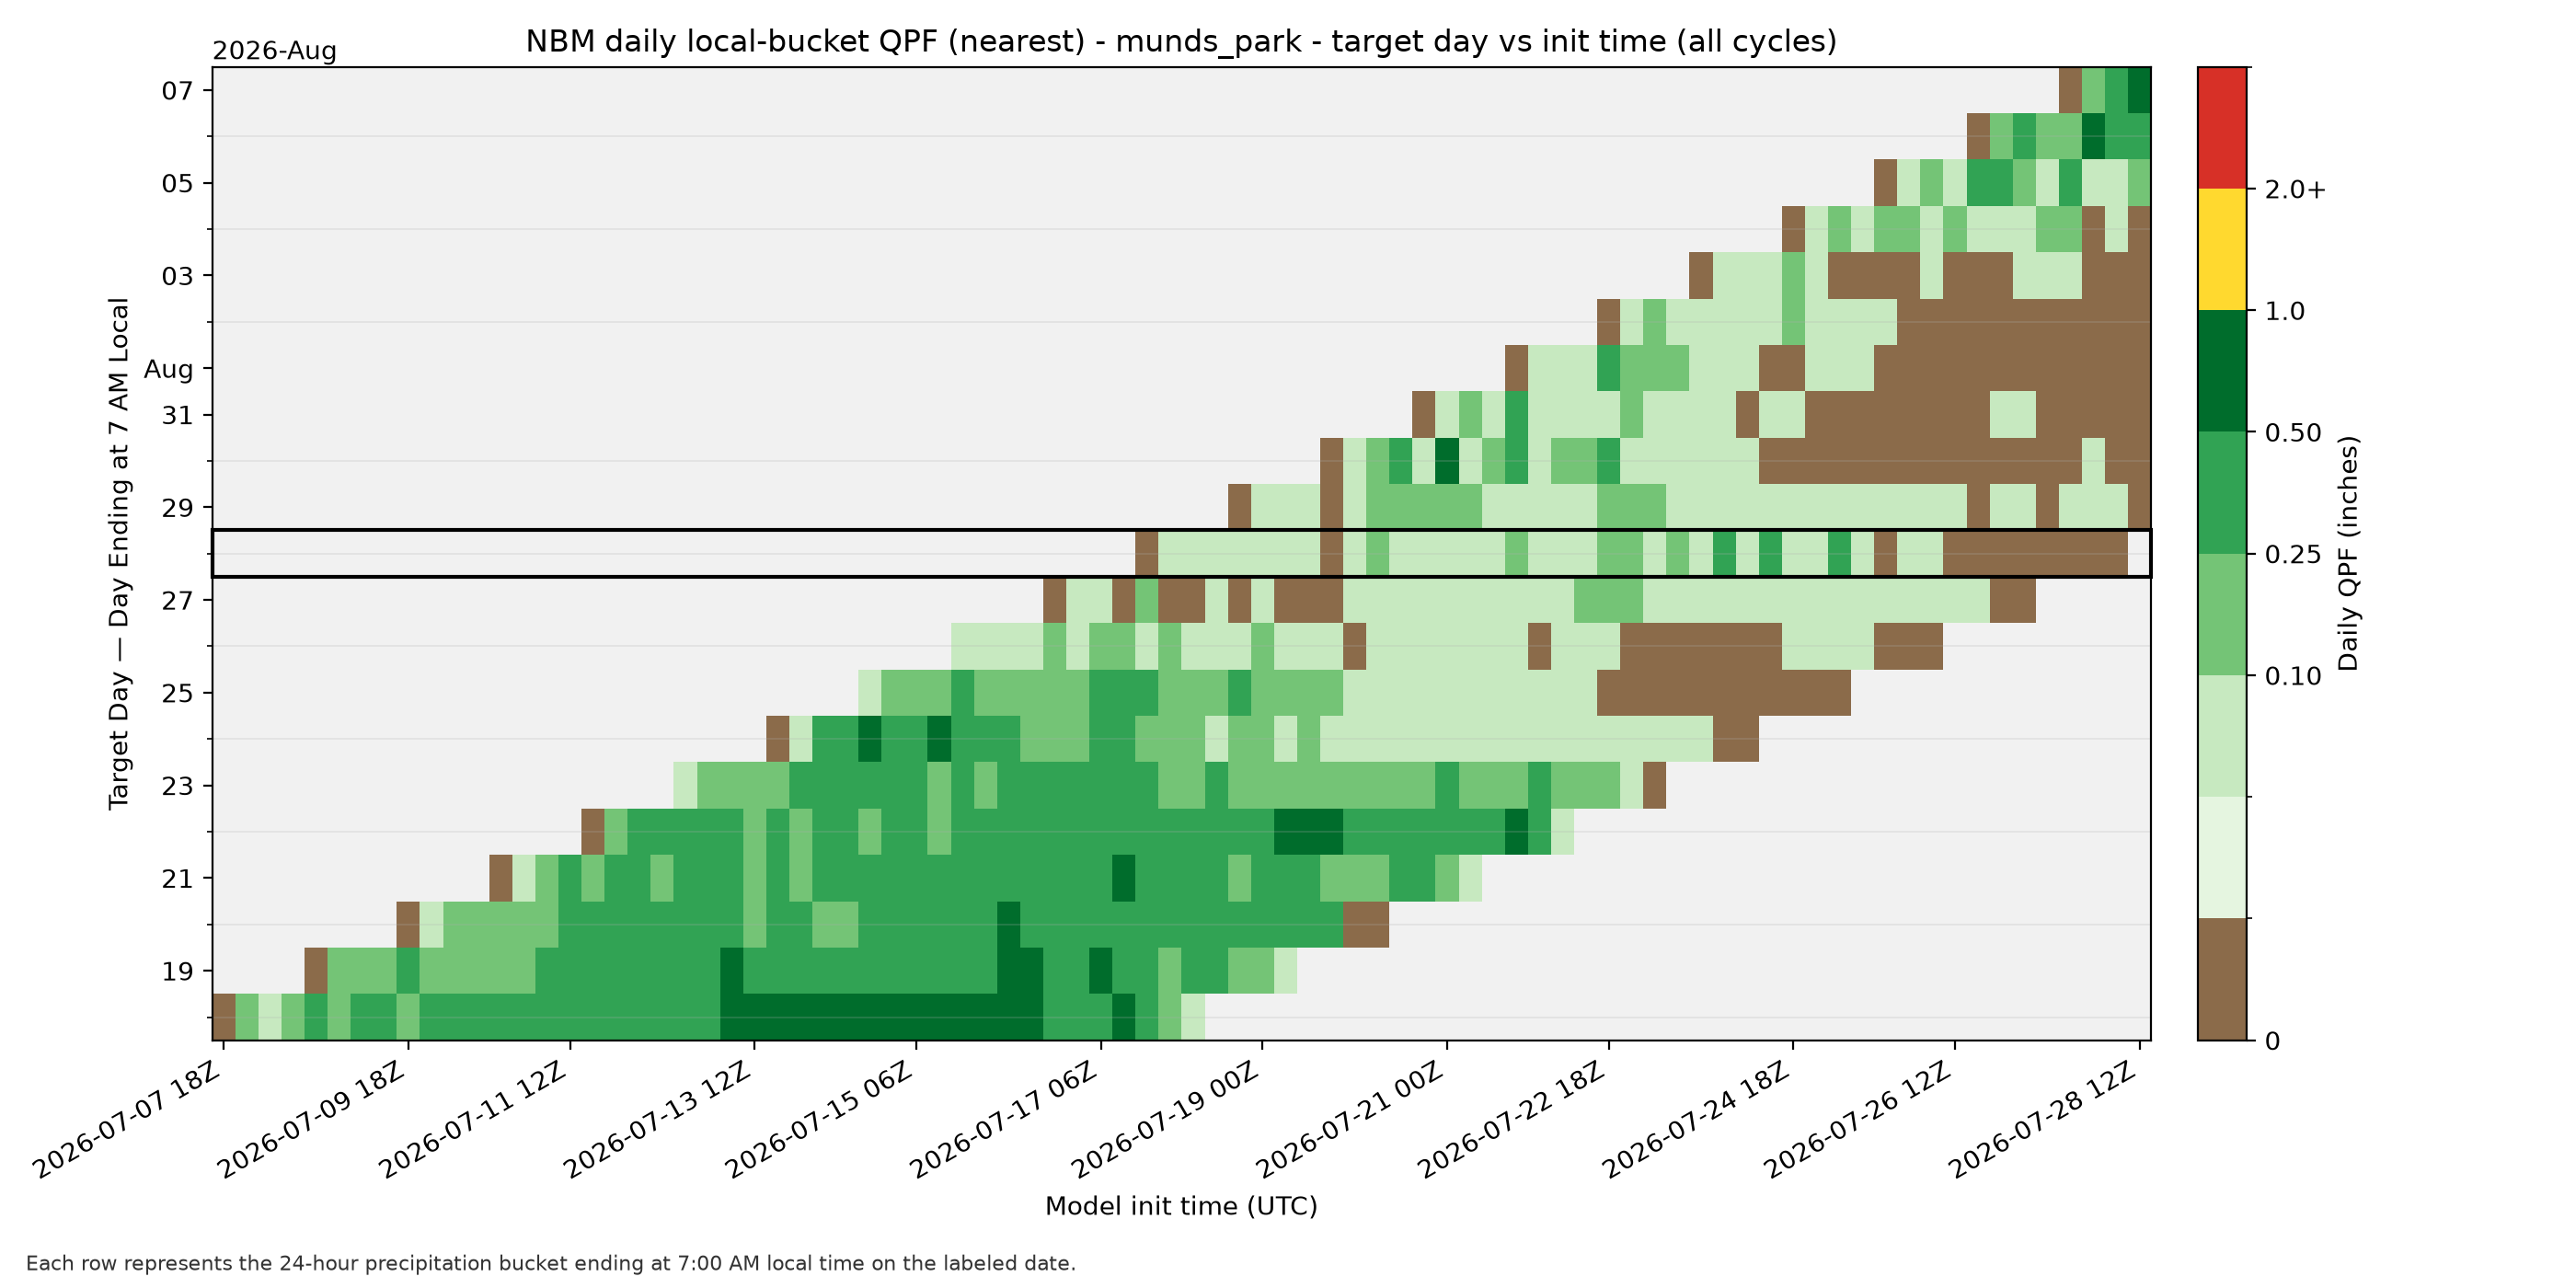
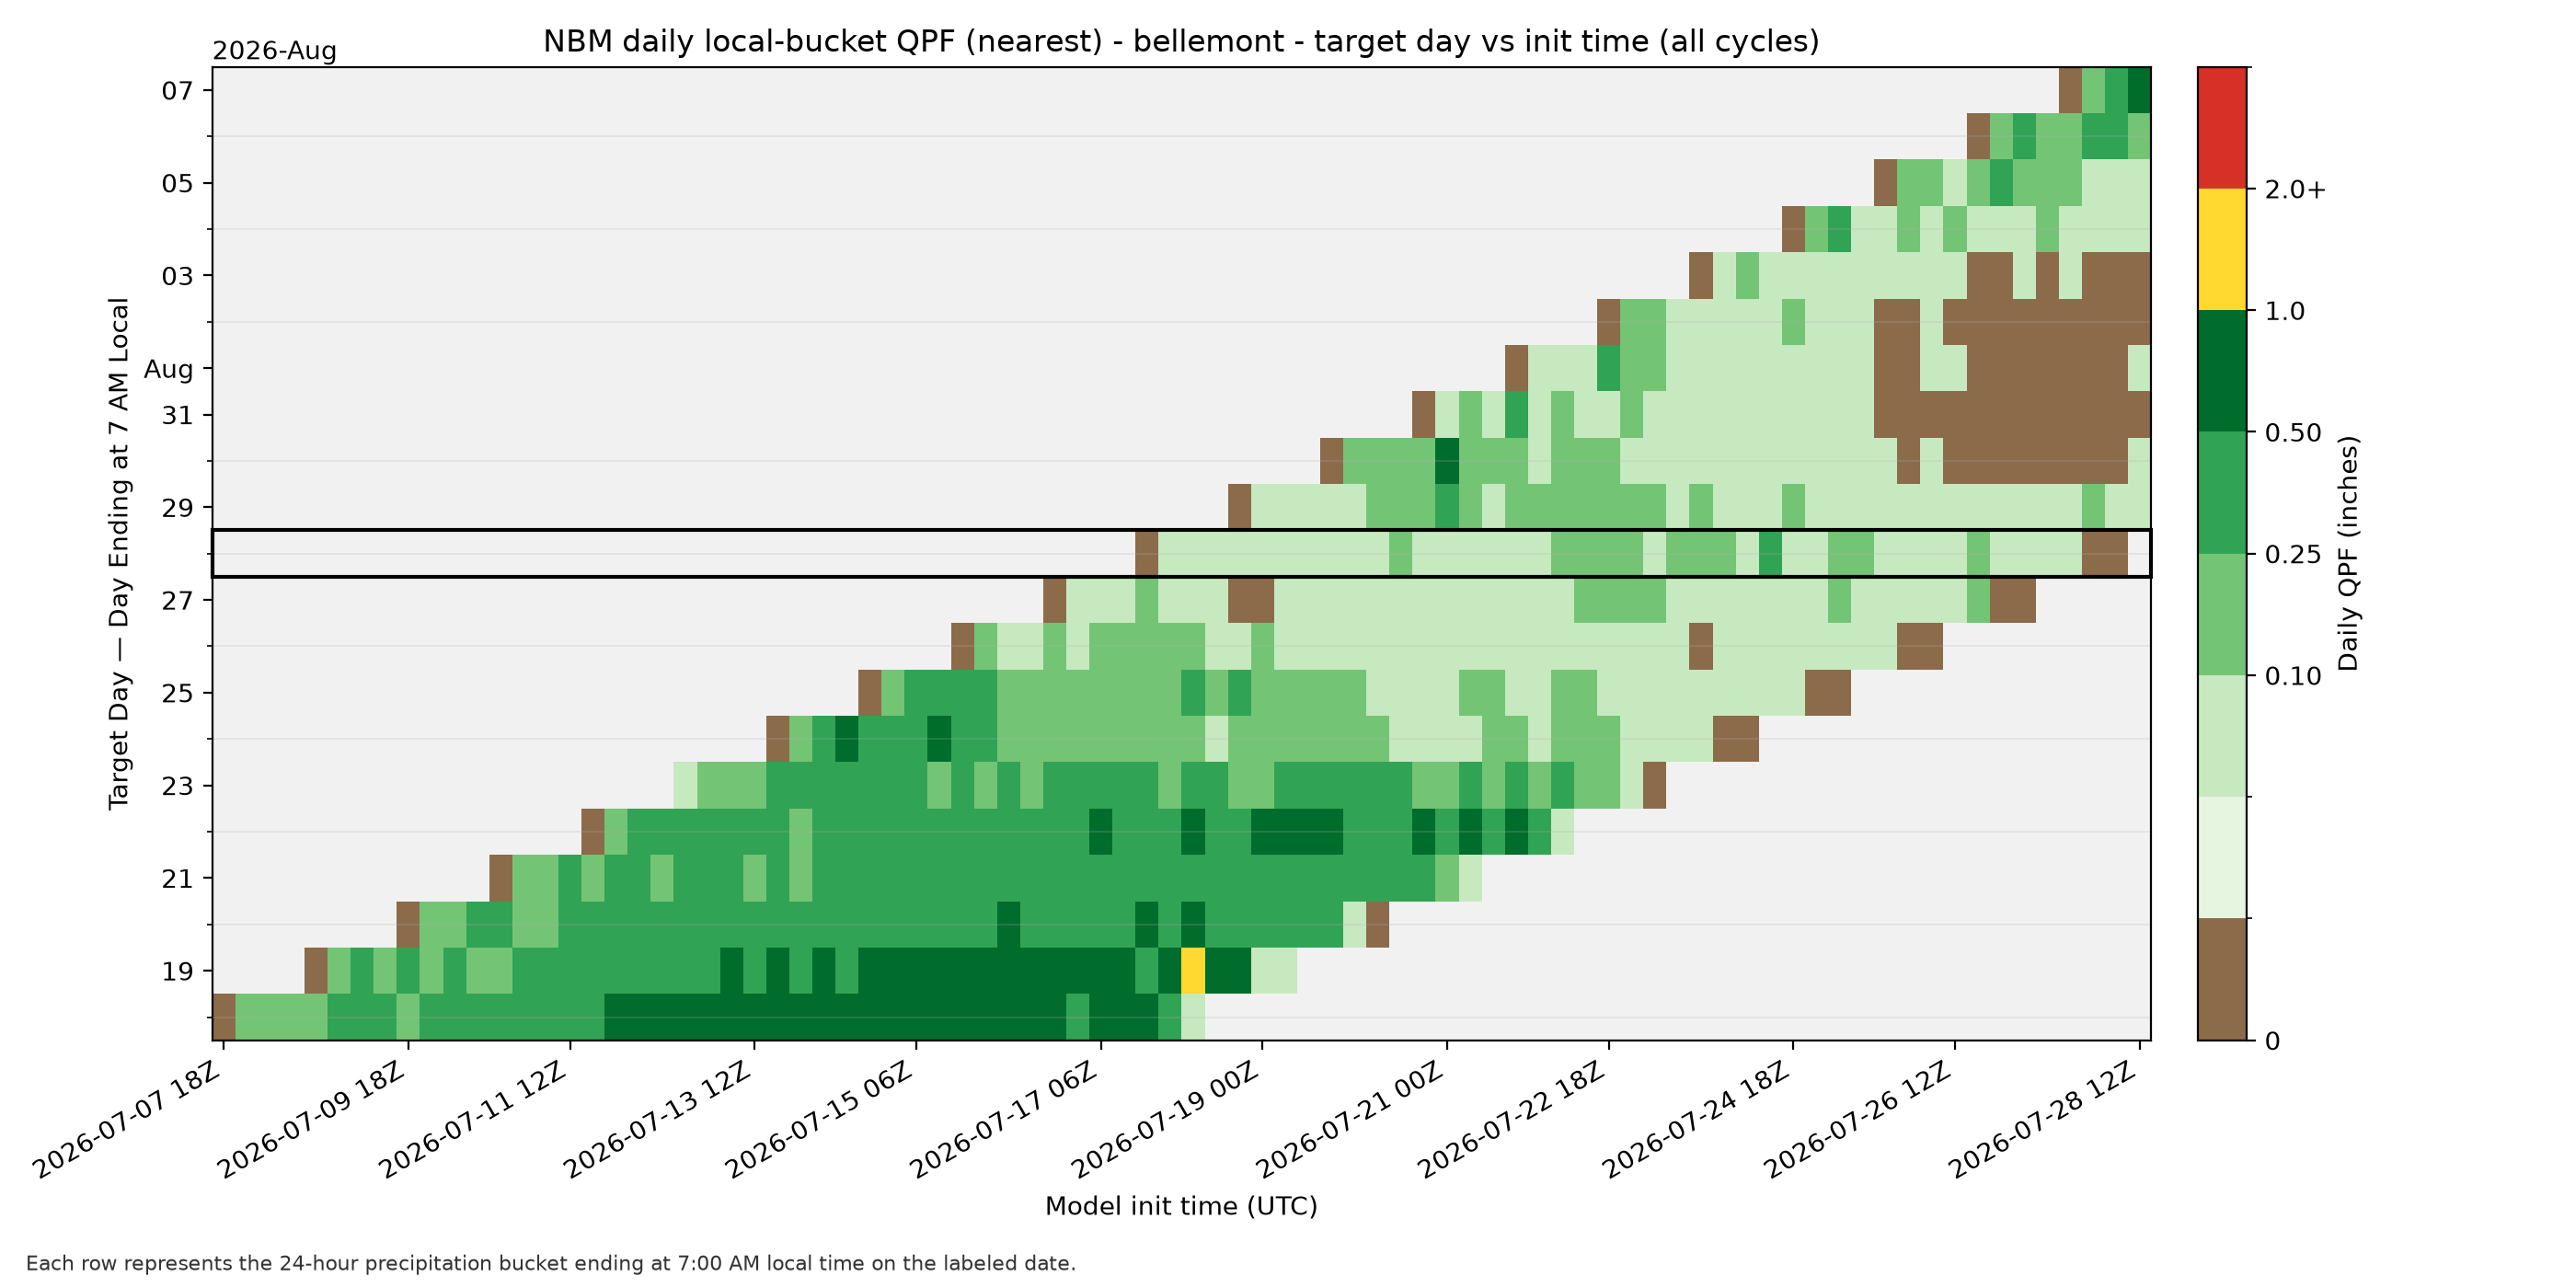
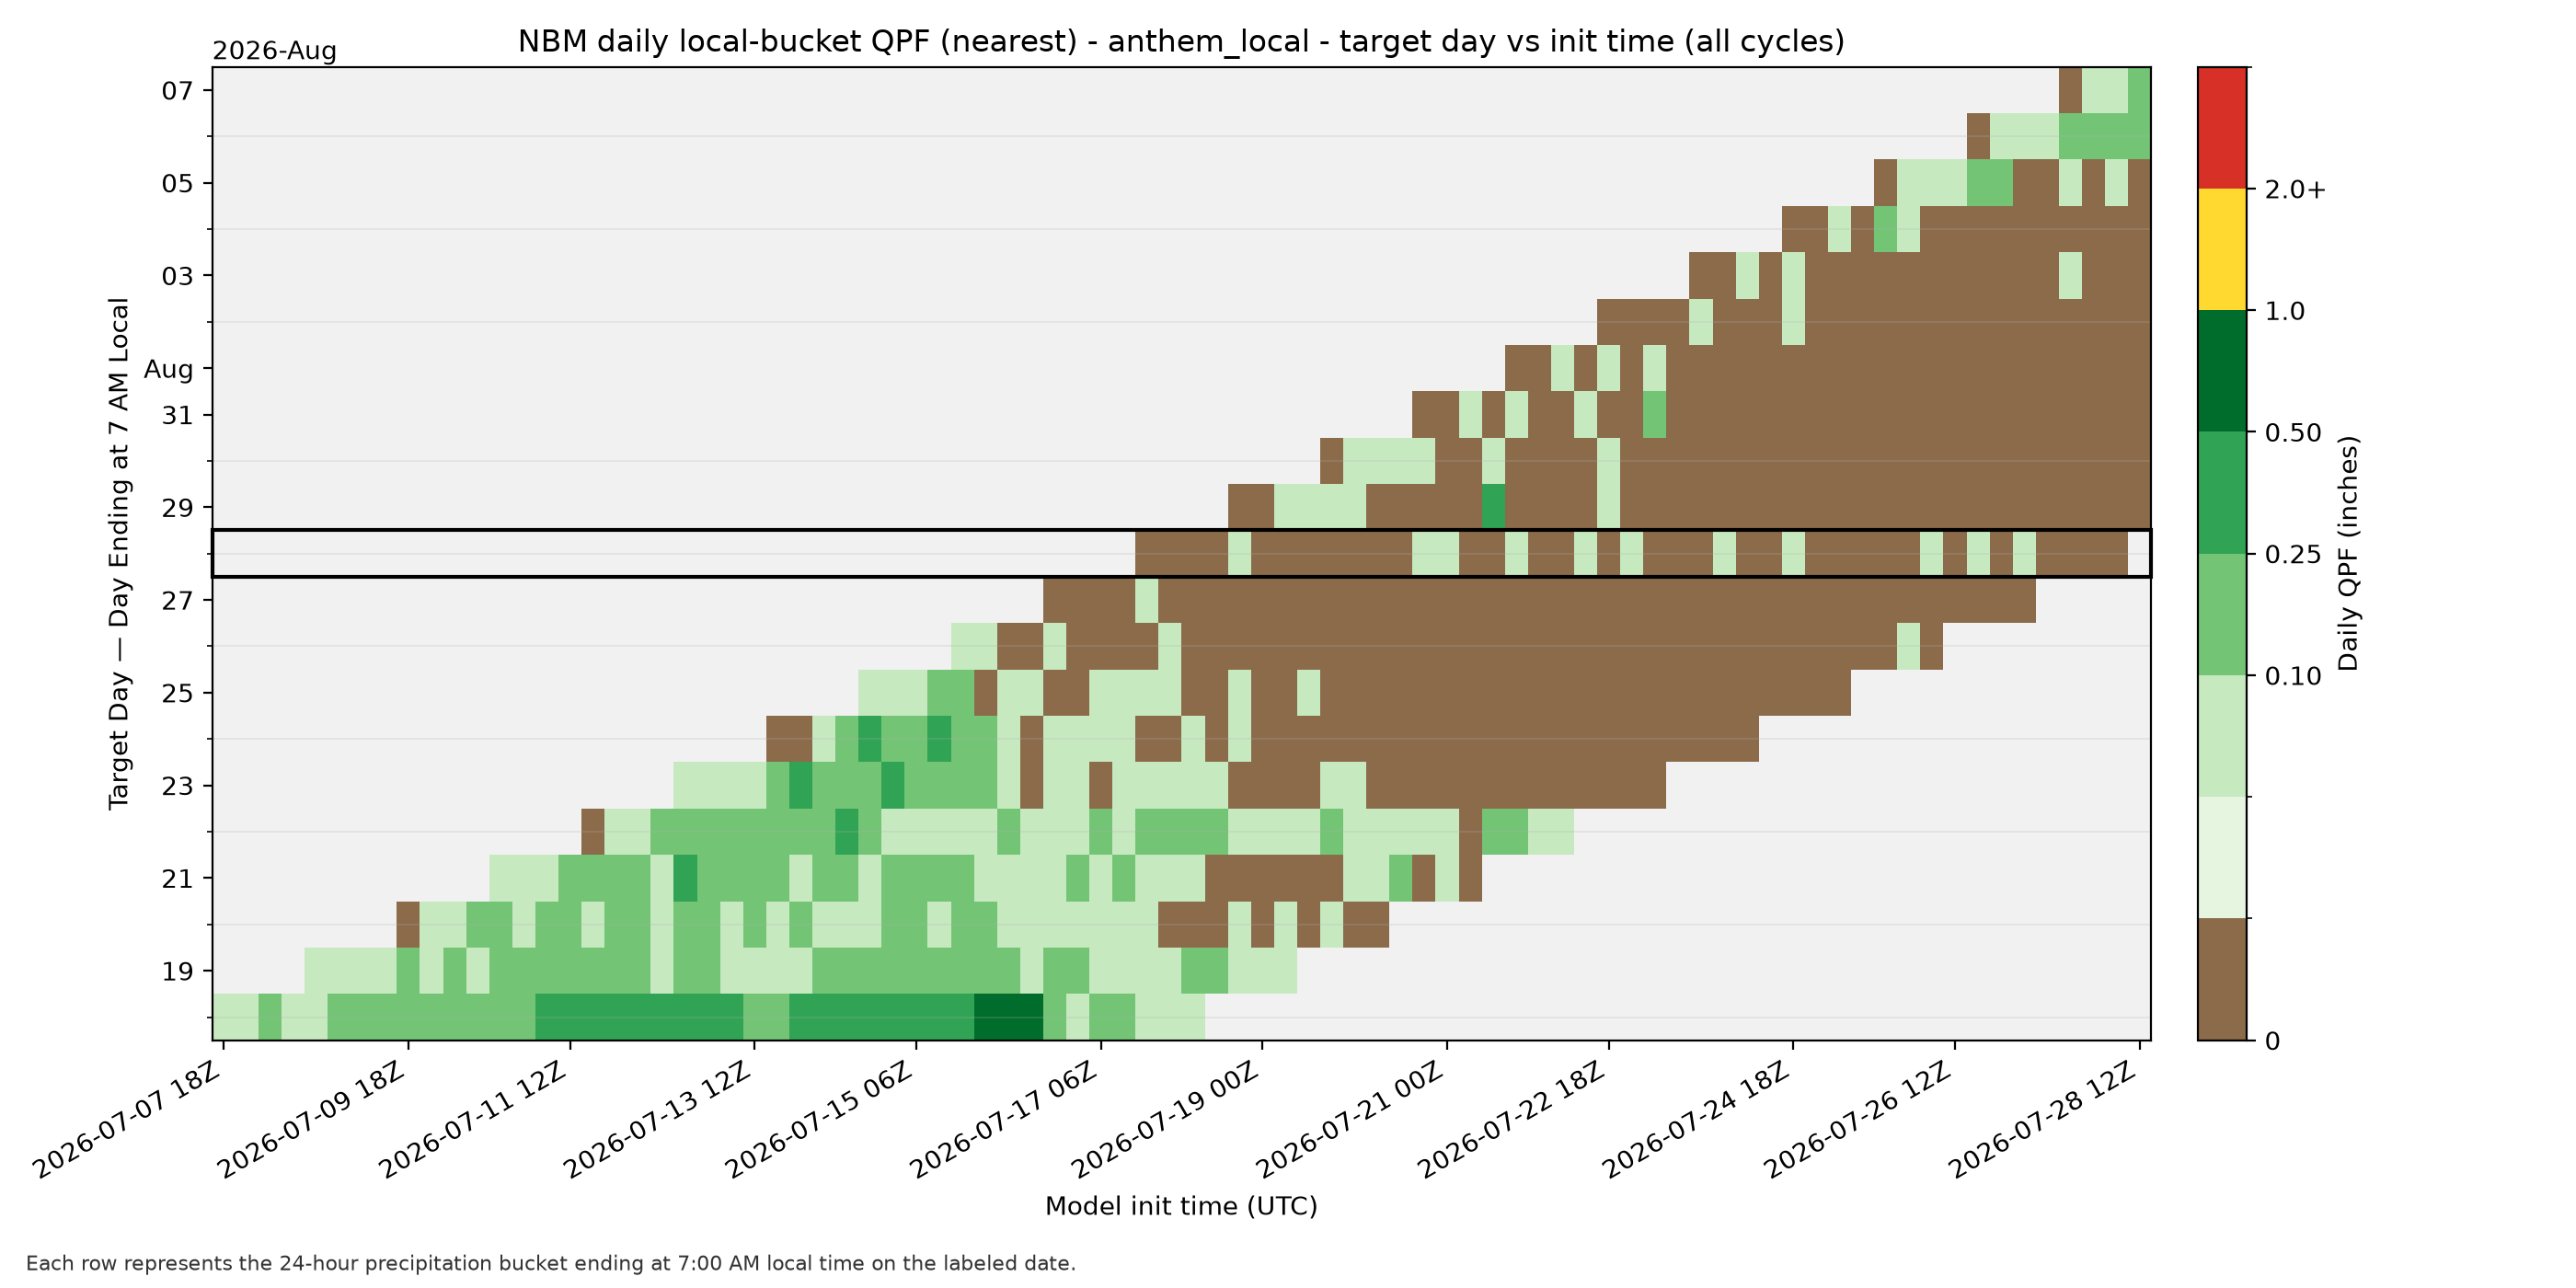
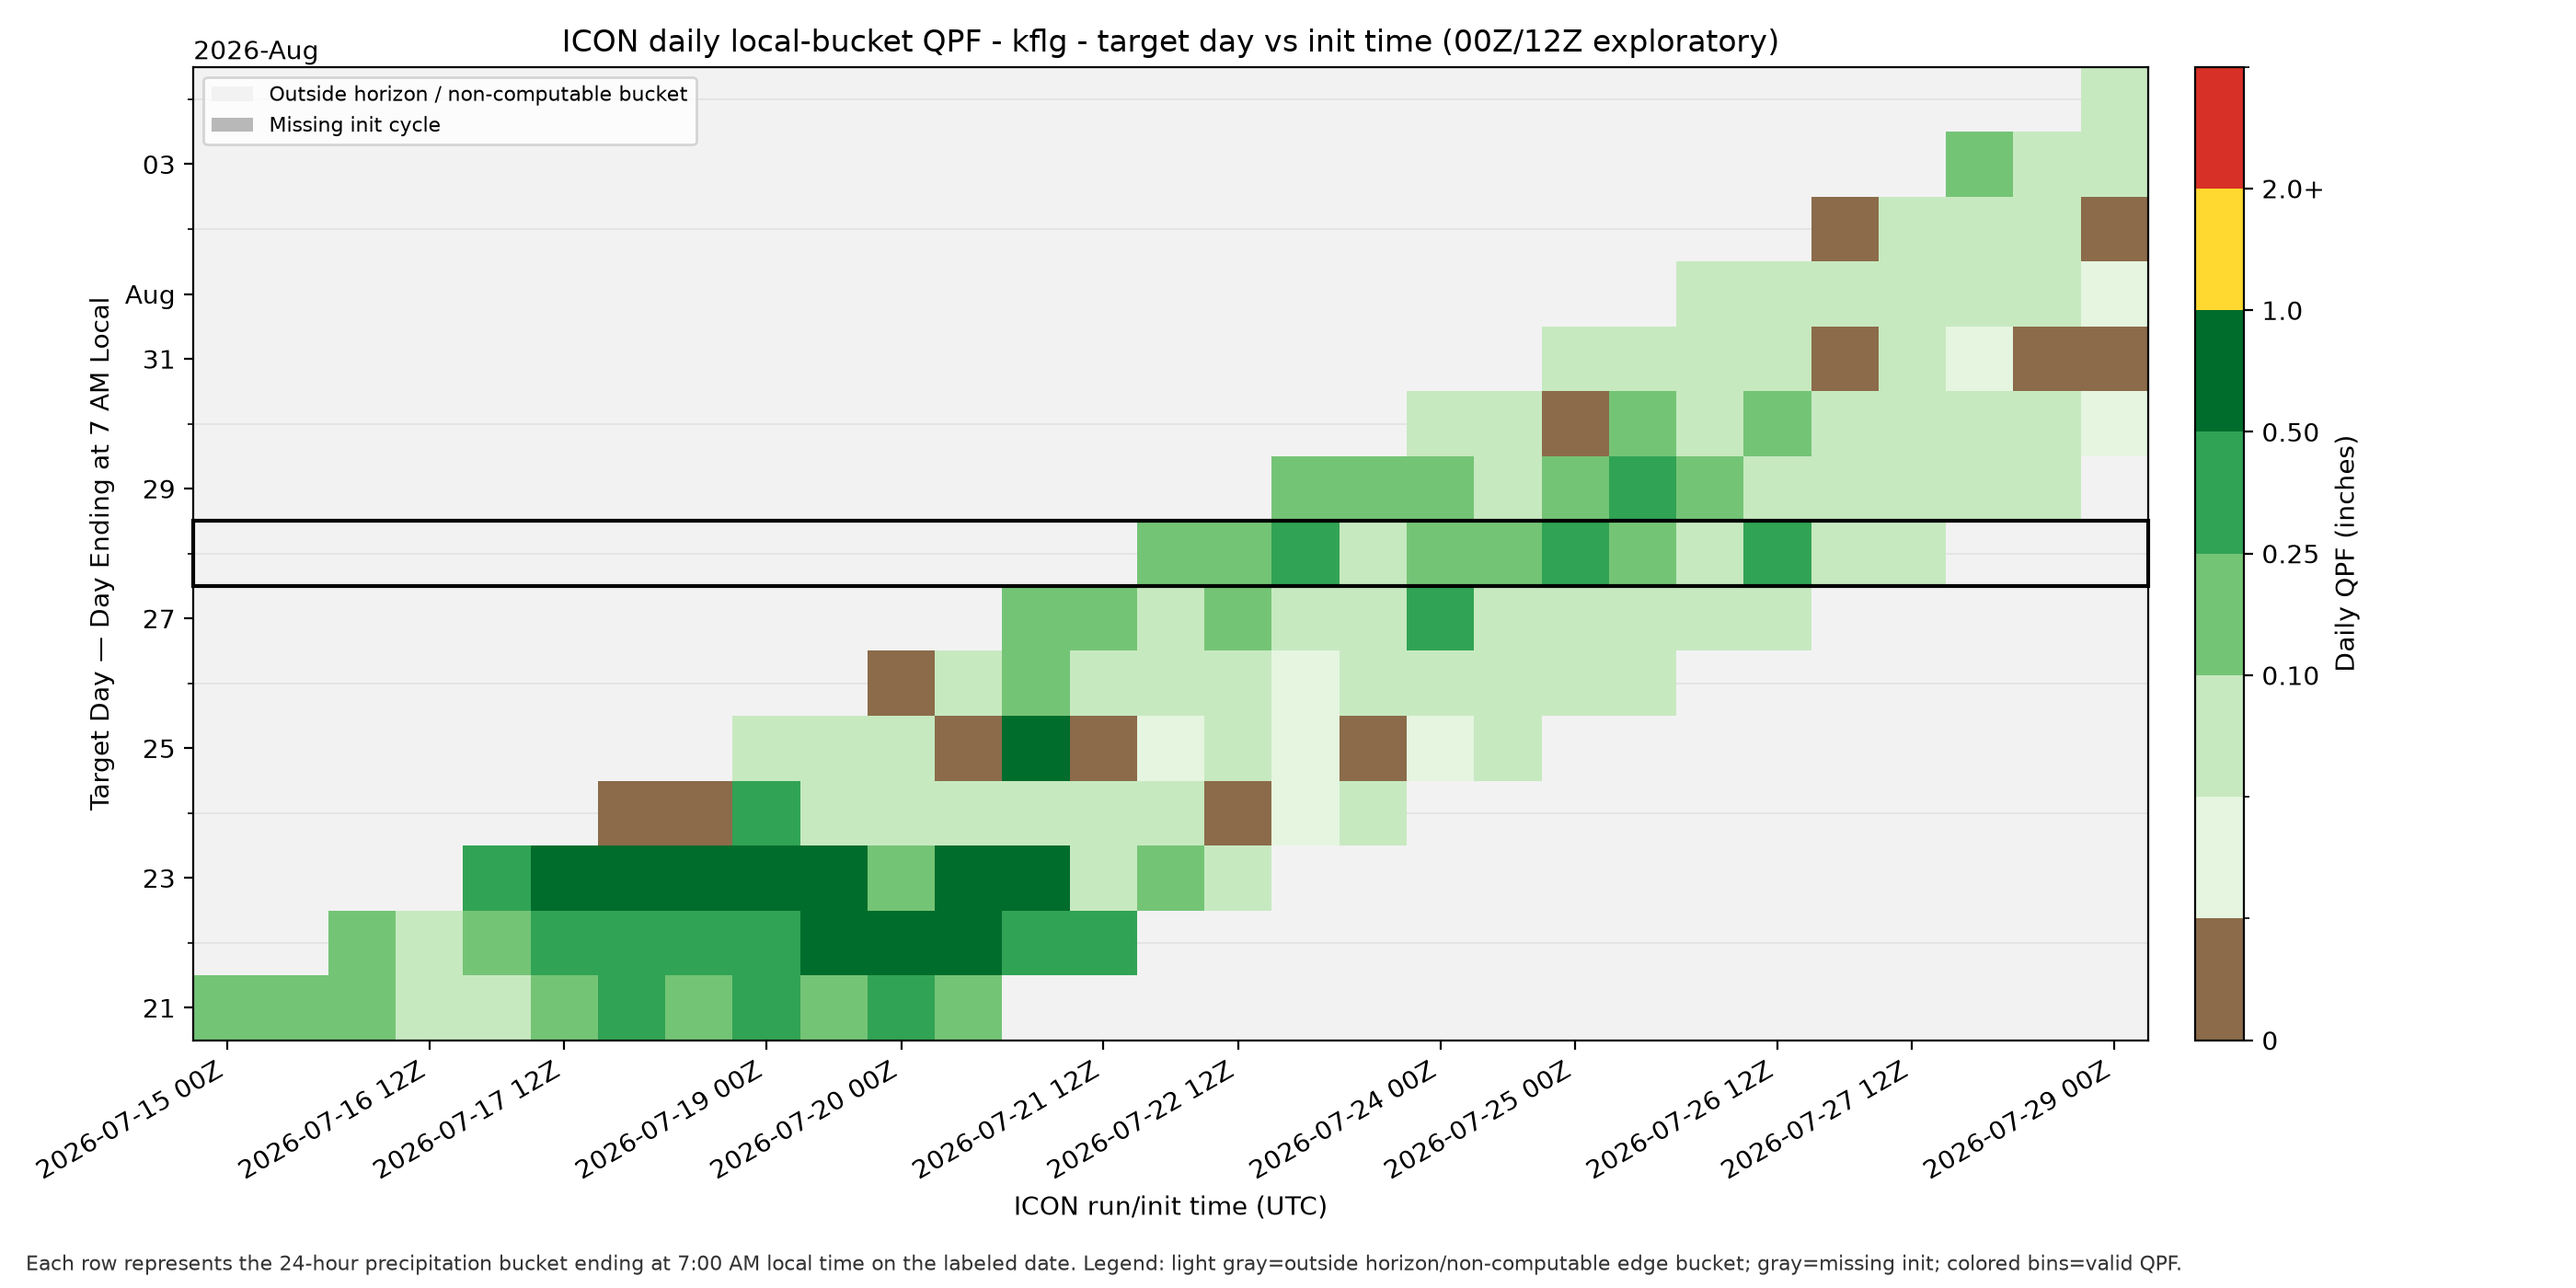
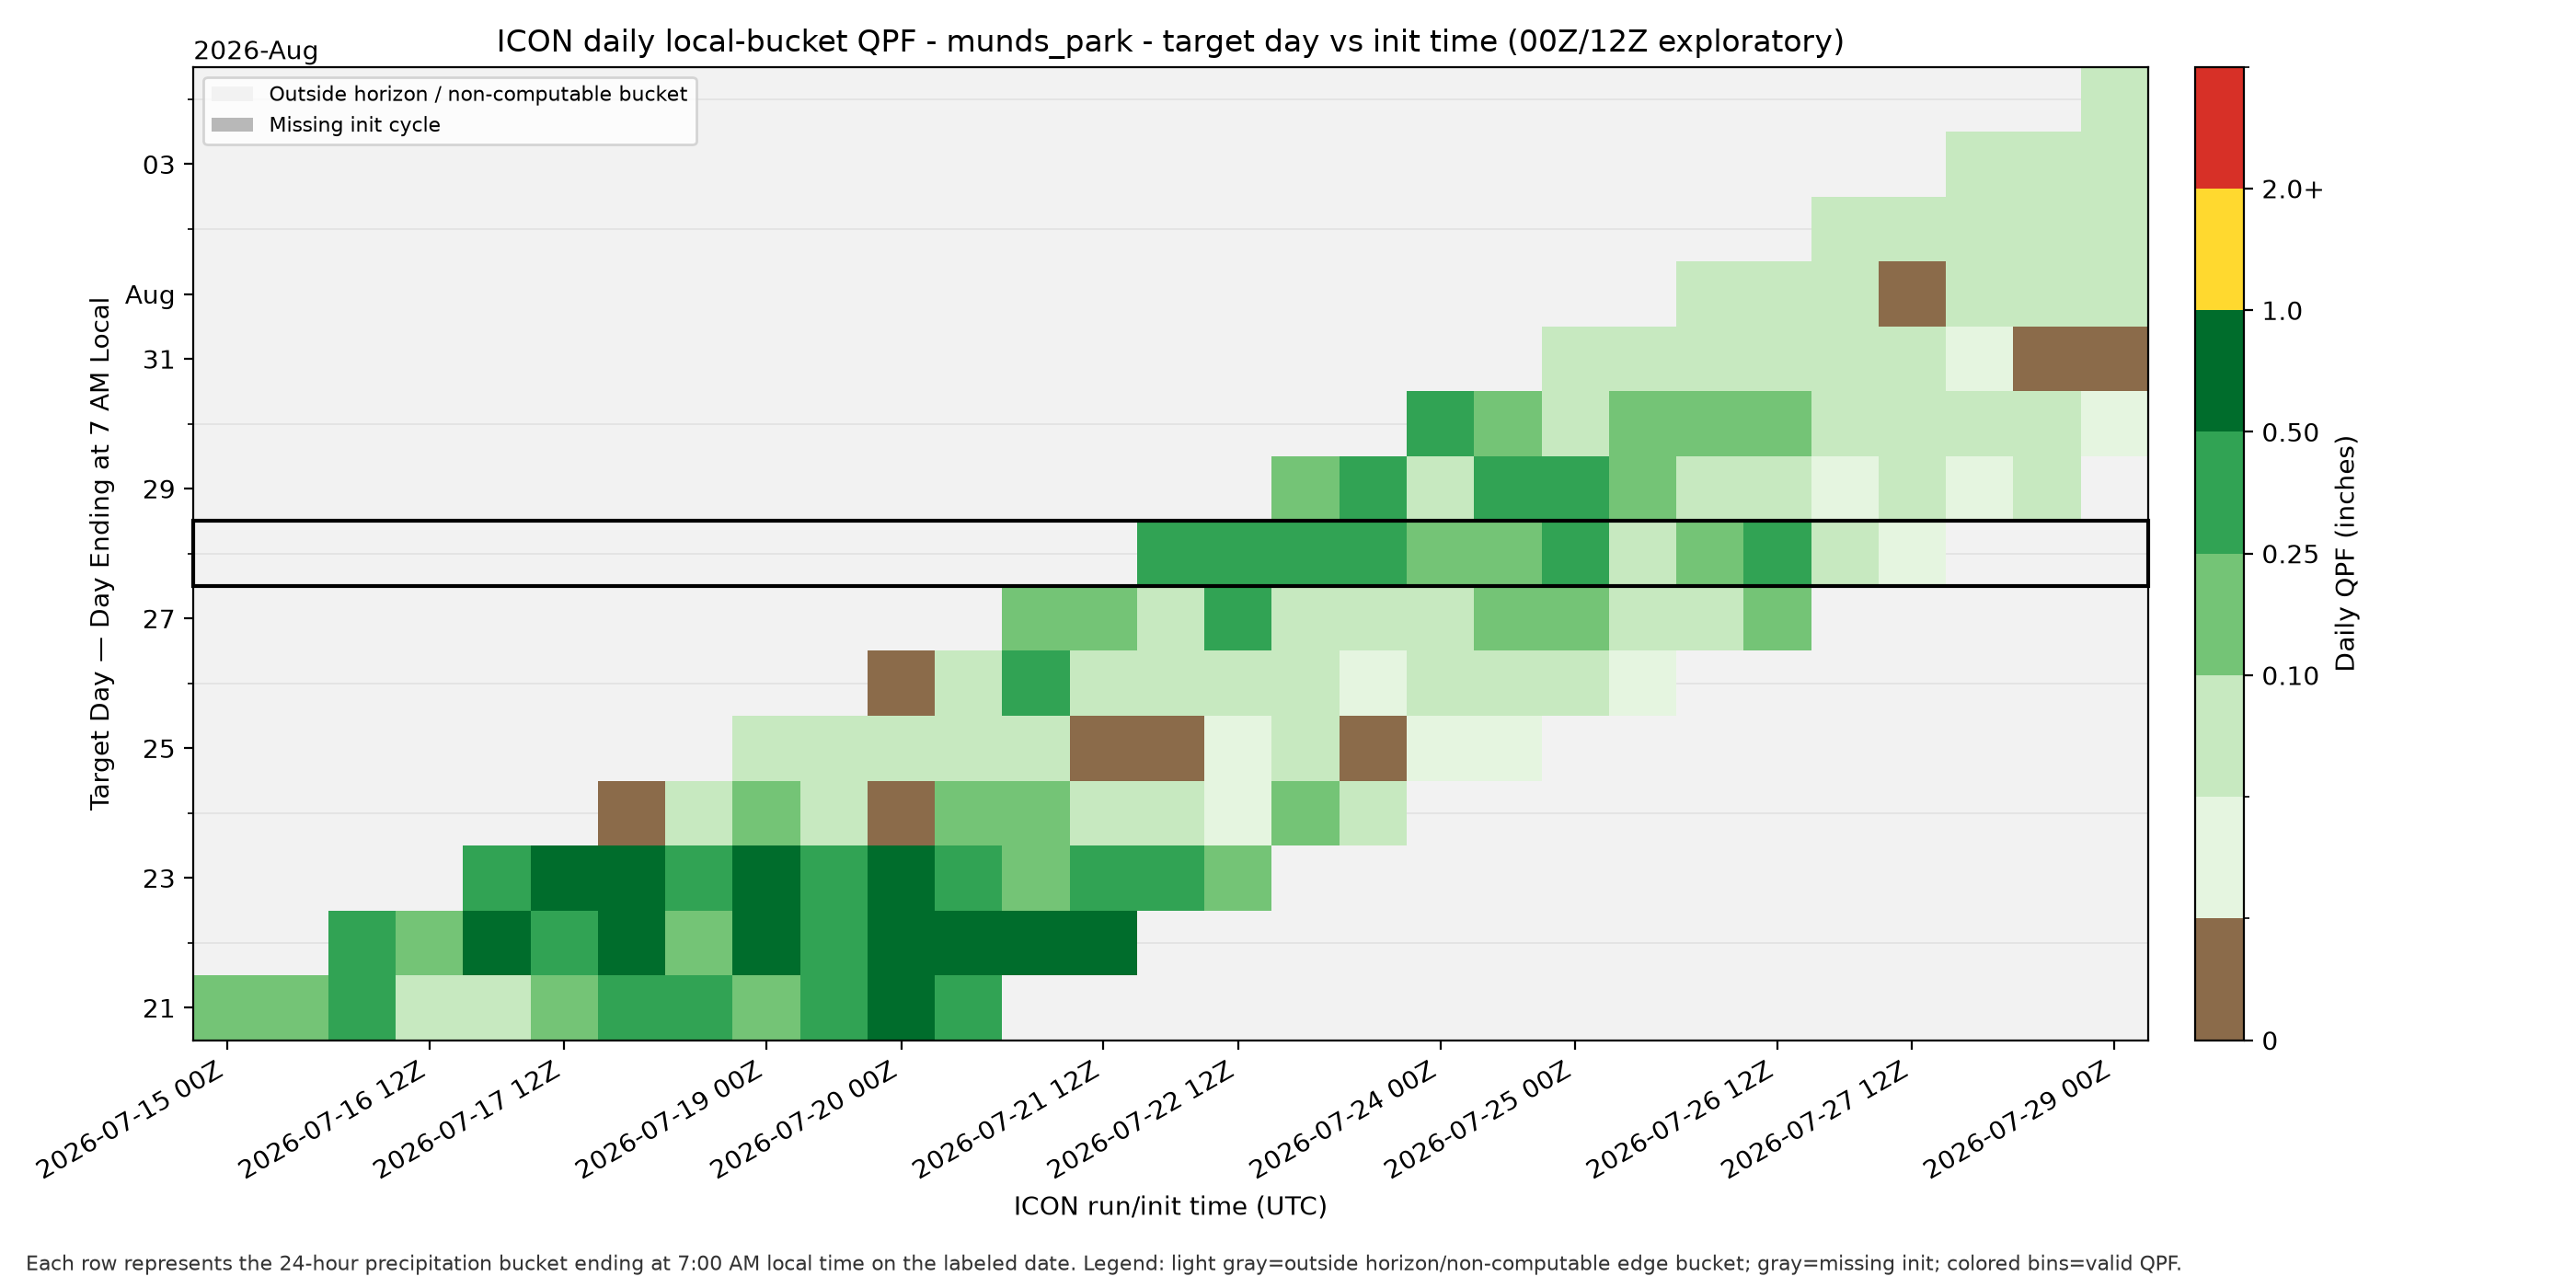
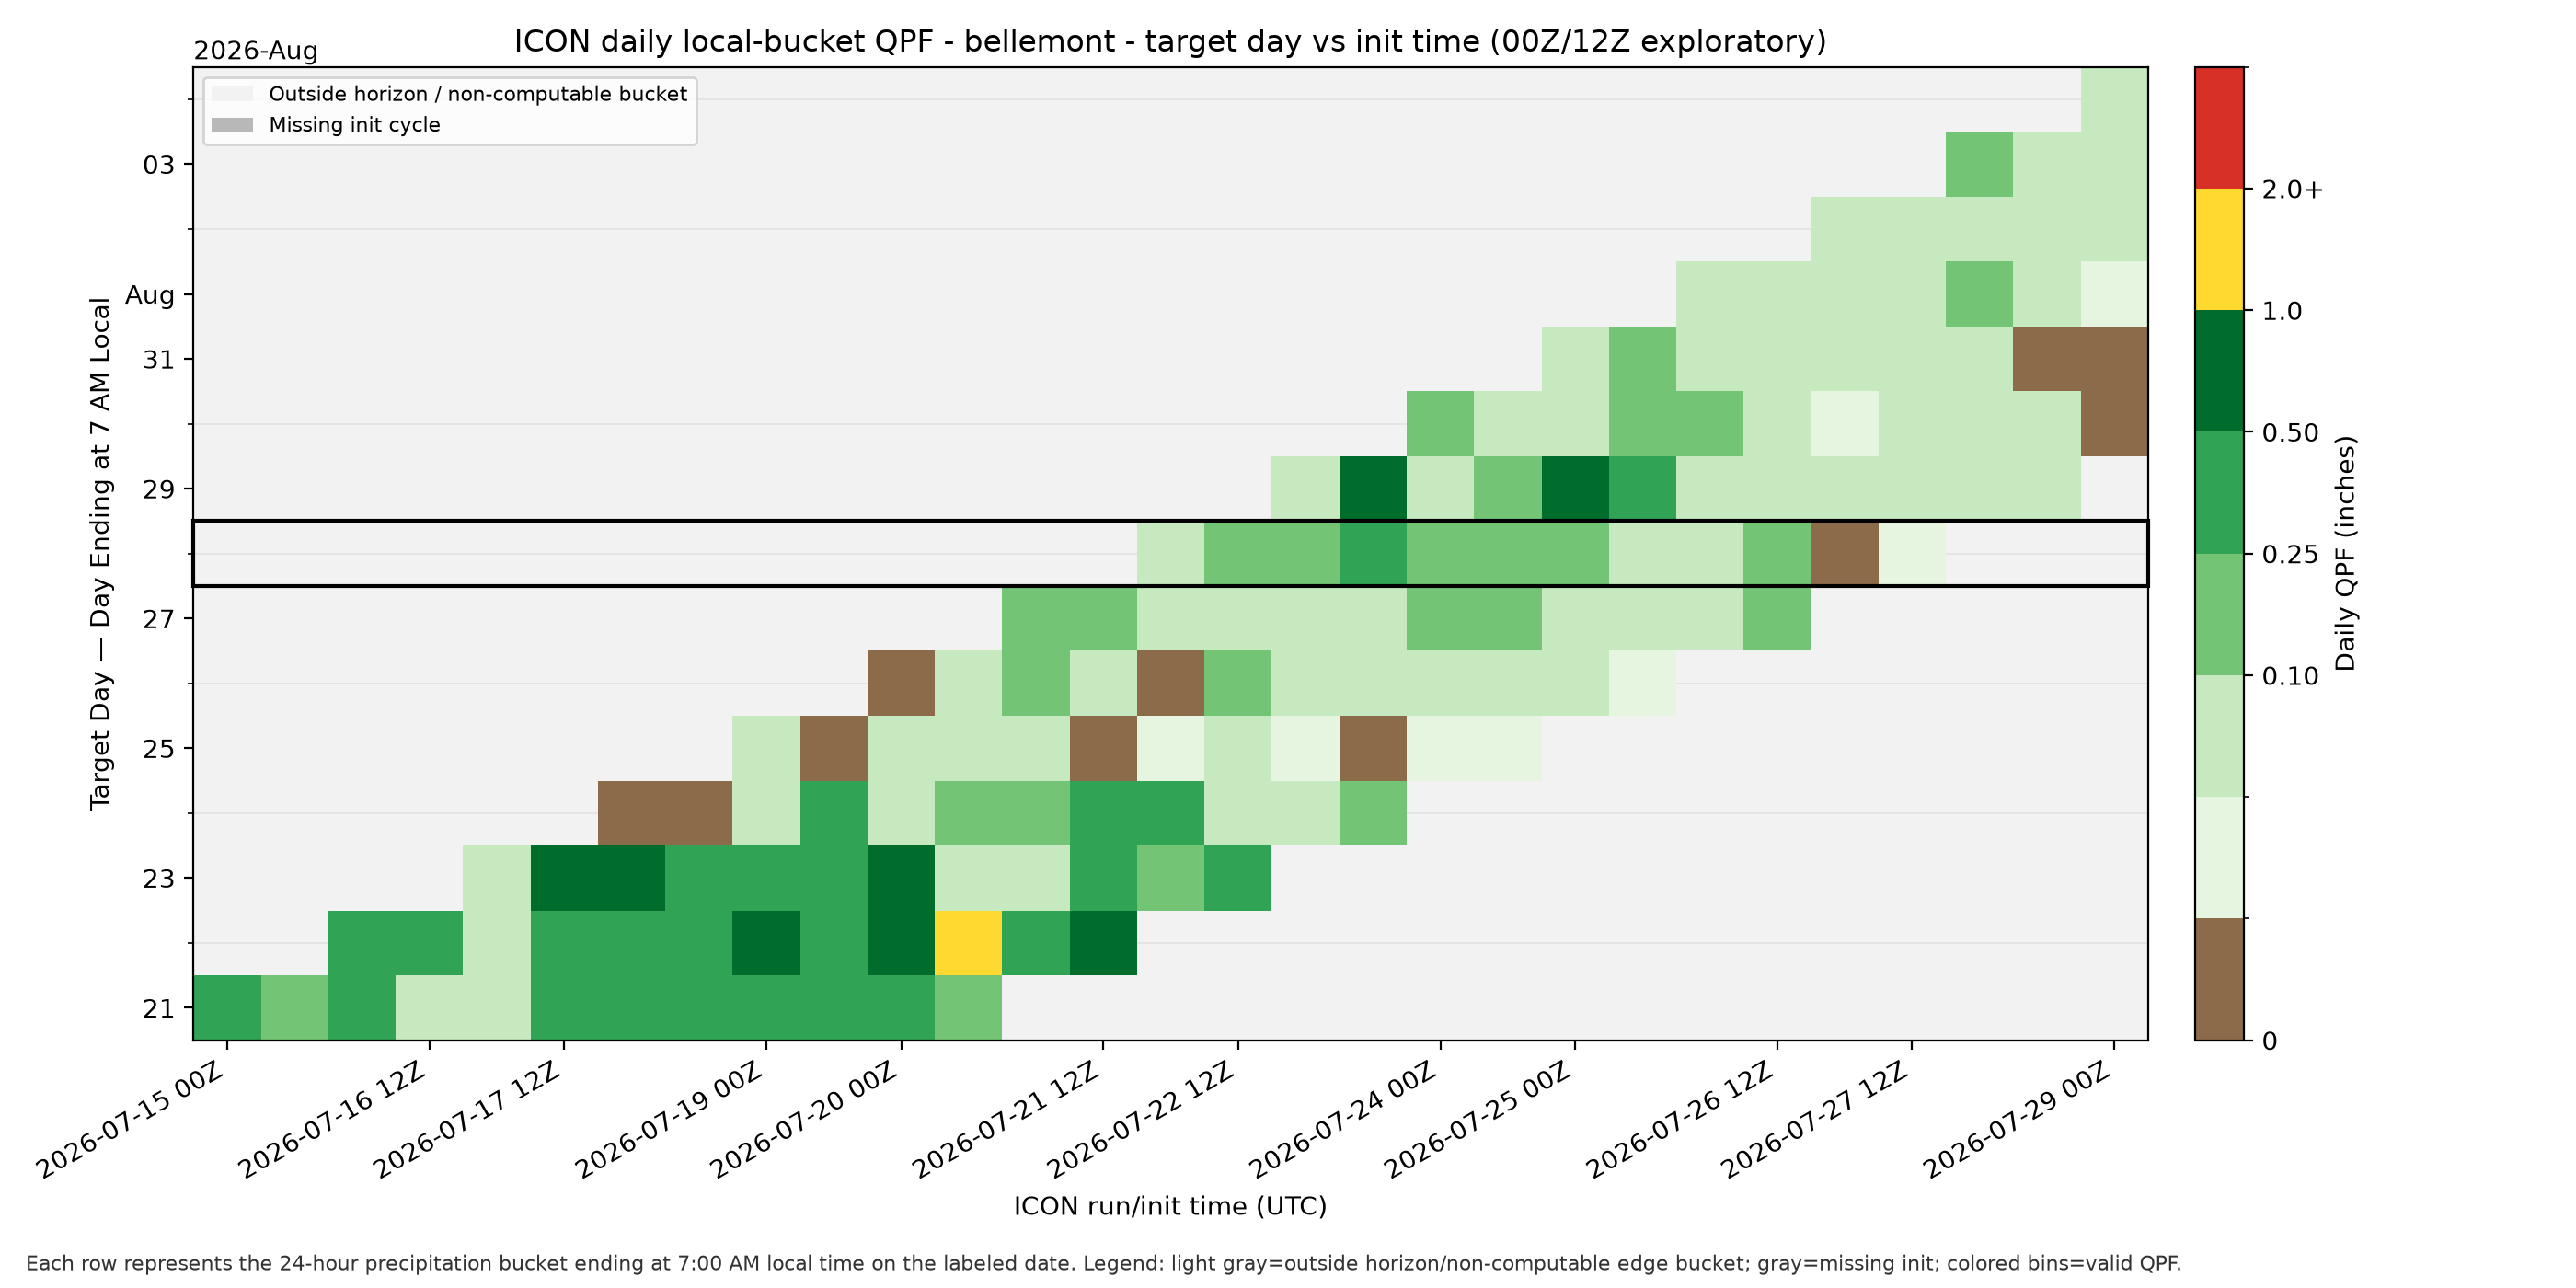
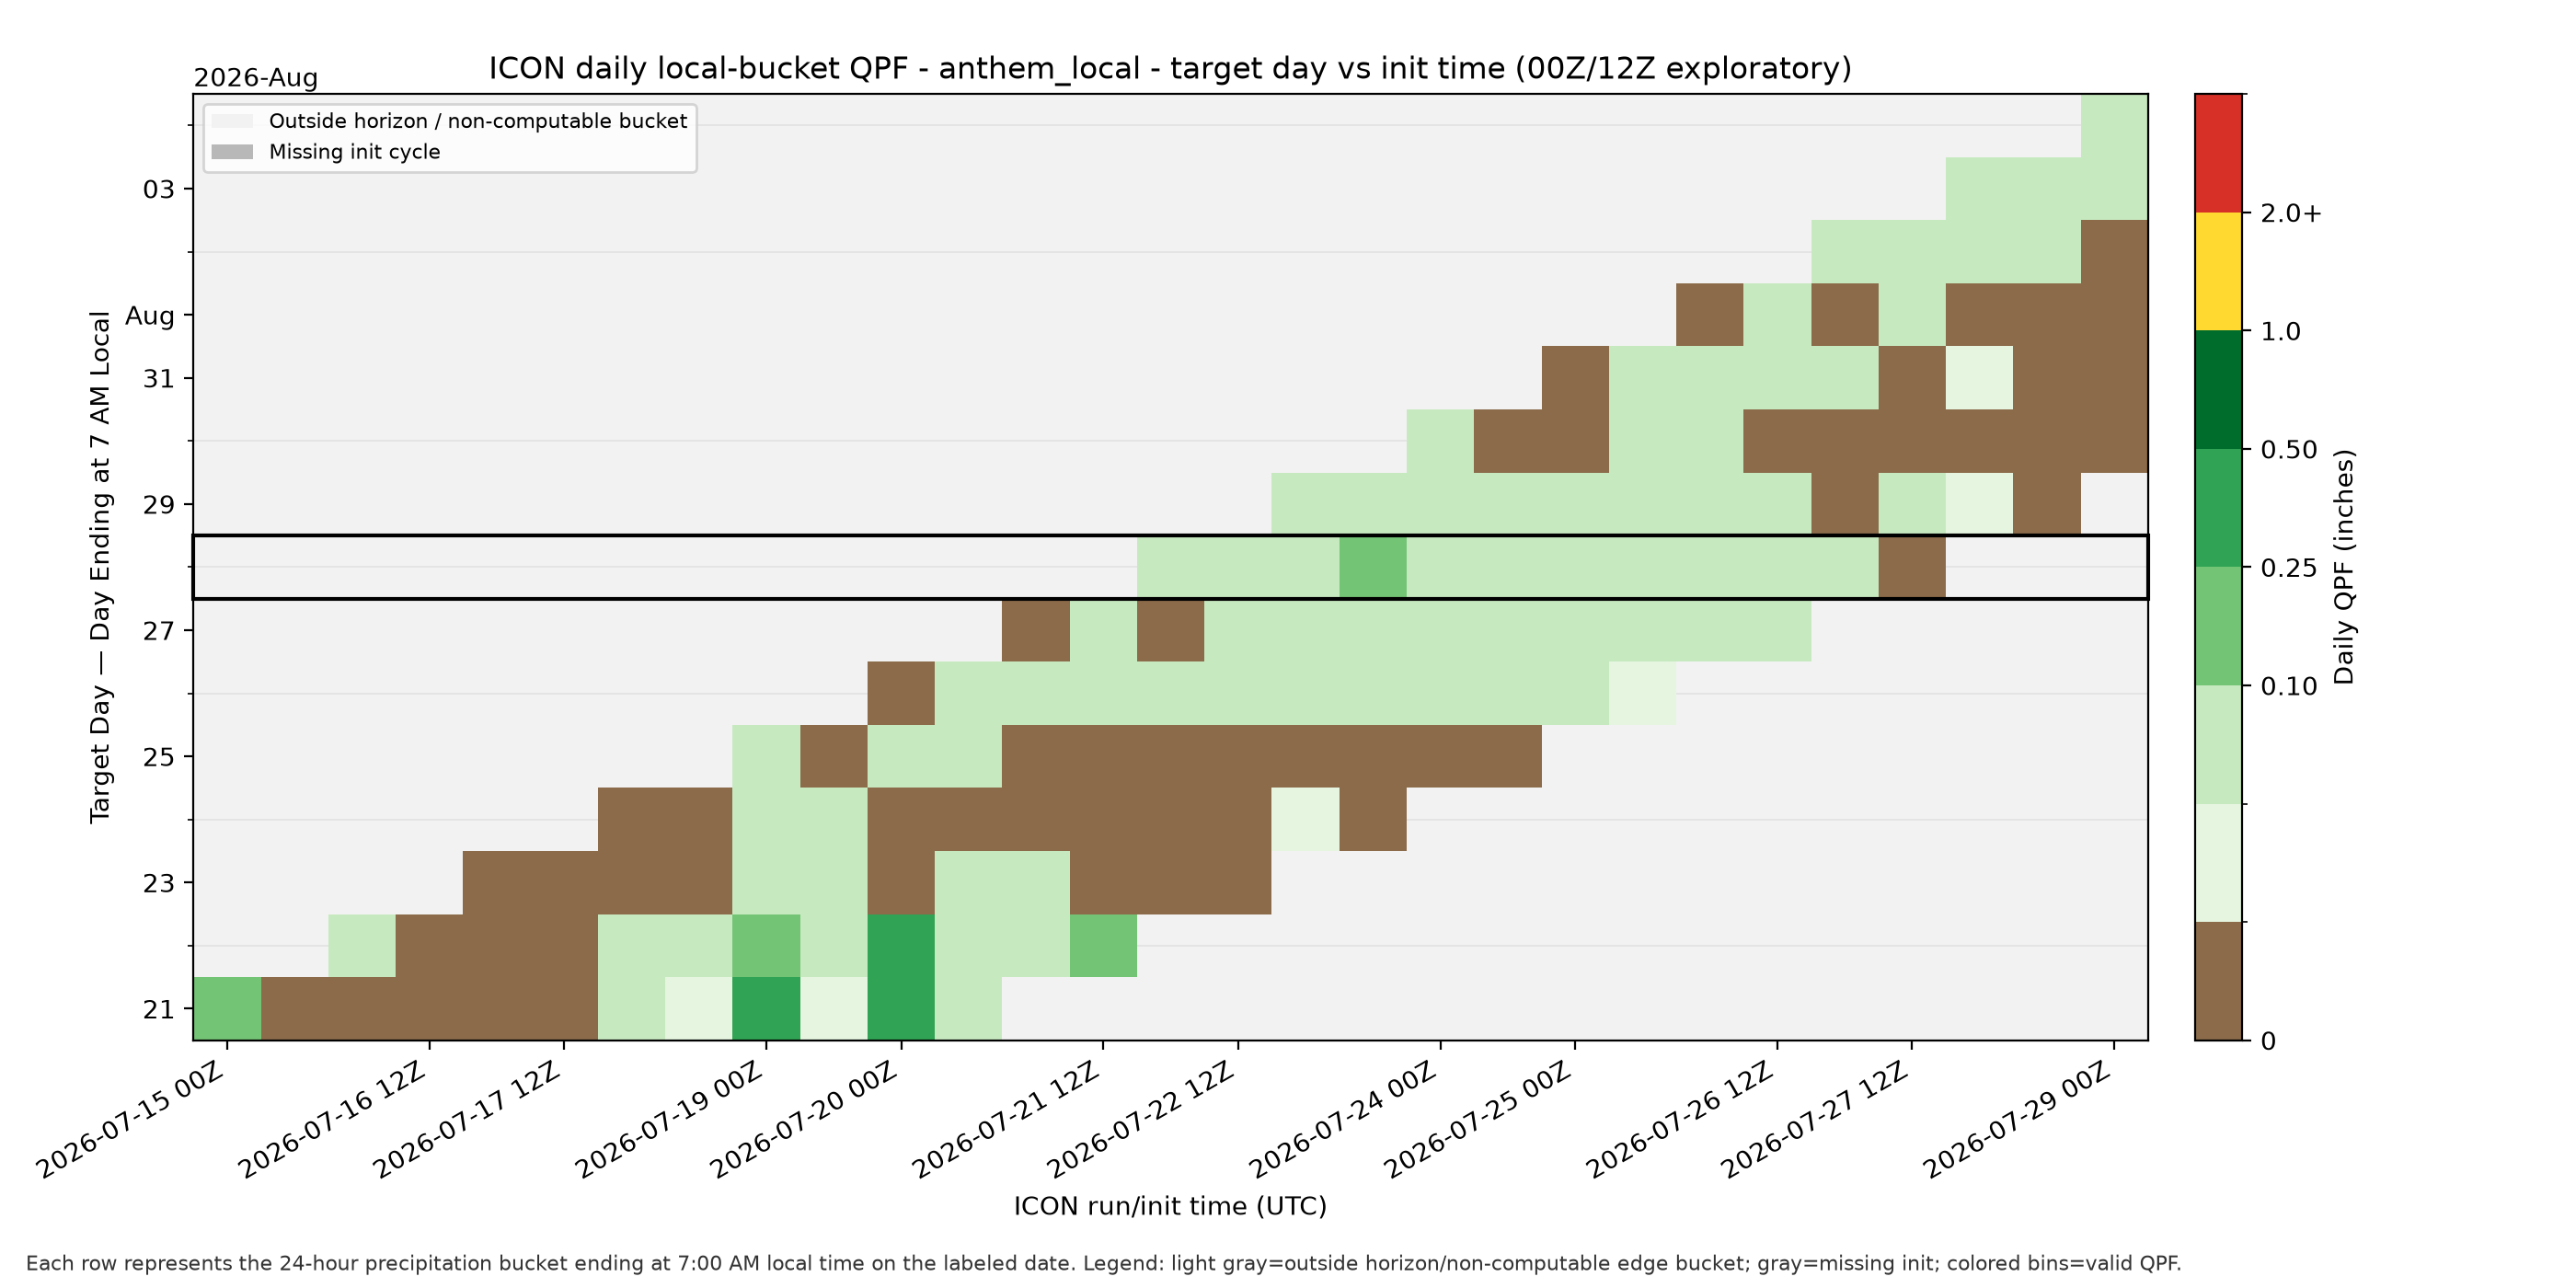
QPF valid-vs-init heatmaps (GFS, IFS, NBM, ICON)
“QPF” is Quantitative Precipitation Forecast — a model’s predicted
rainfall amount. Each heatmap has two time axes: one is the forecast’s
initialization time (when that model run started, i.e. how many days ahead of
time the forecast was made), and the other is the valid date (the actual calendar
day being forecast for). Reading across a row shows how the forecast for one specific day
changed as it got closer — whether a model was consistent about a coming rain event
from run to run, or whether its guess for that day swung around a lot before settling down.
Bilinear vs. nearest interpolation
Weather models compute forecasts on a grid of points spaced miles apart, not at exact
addresses. To estimate a value at one specific spot, this pipeline uses one of two methods:
nearest simply takes the value from the single closest grid point, while
bilinear blends the four surrounding grid points, weighted by distance, for
a smoothed estimate. In steep or mixed terrain — like the transition from desert floor
to forested peaks around these sites — the two methods can disagree noticeably. Showing
both side by side is a way to see how sensitive a forecast is to that choice, not a signal
that one method is “right” and the other “wrong.” ICON heatmaps use a
single extraction method rather than both.
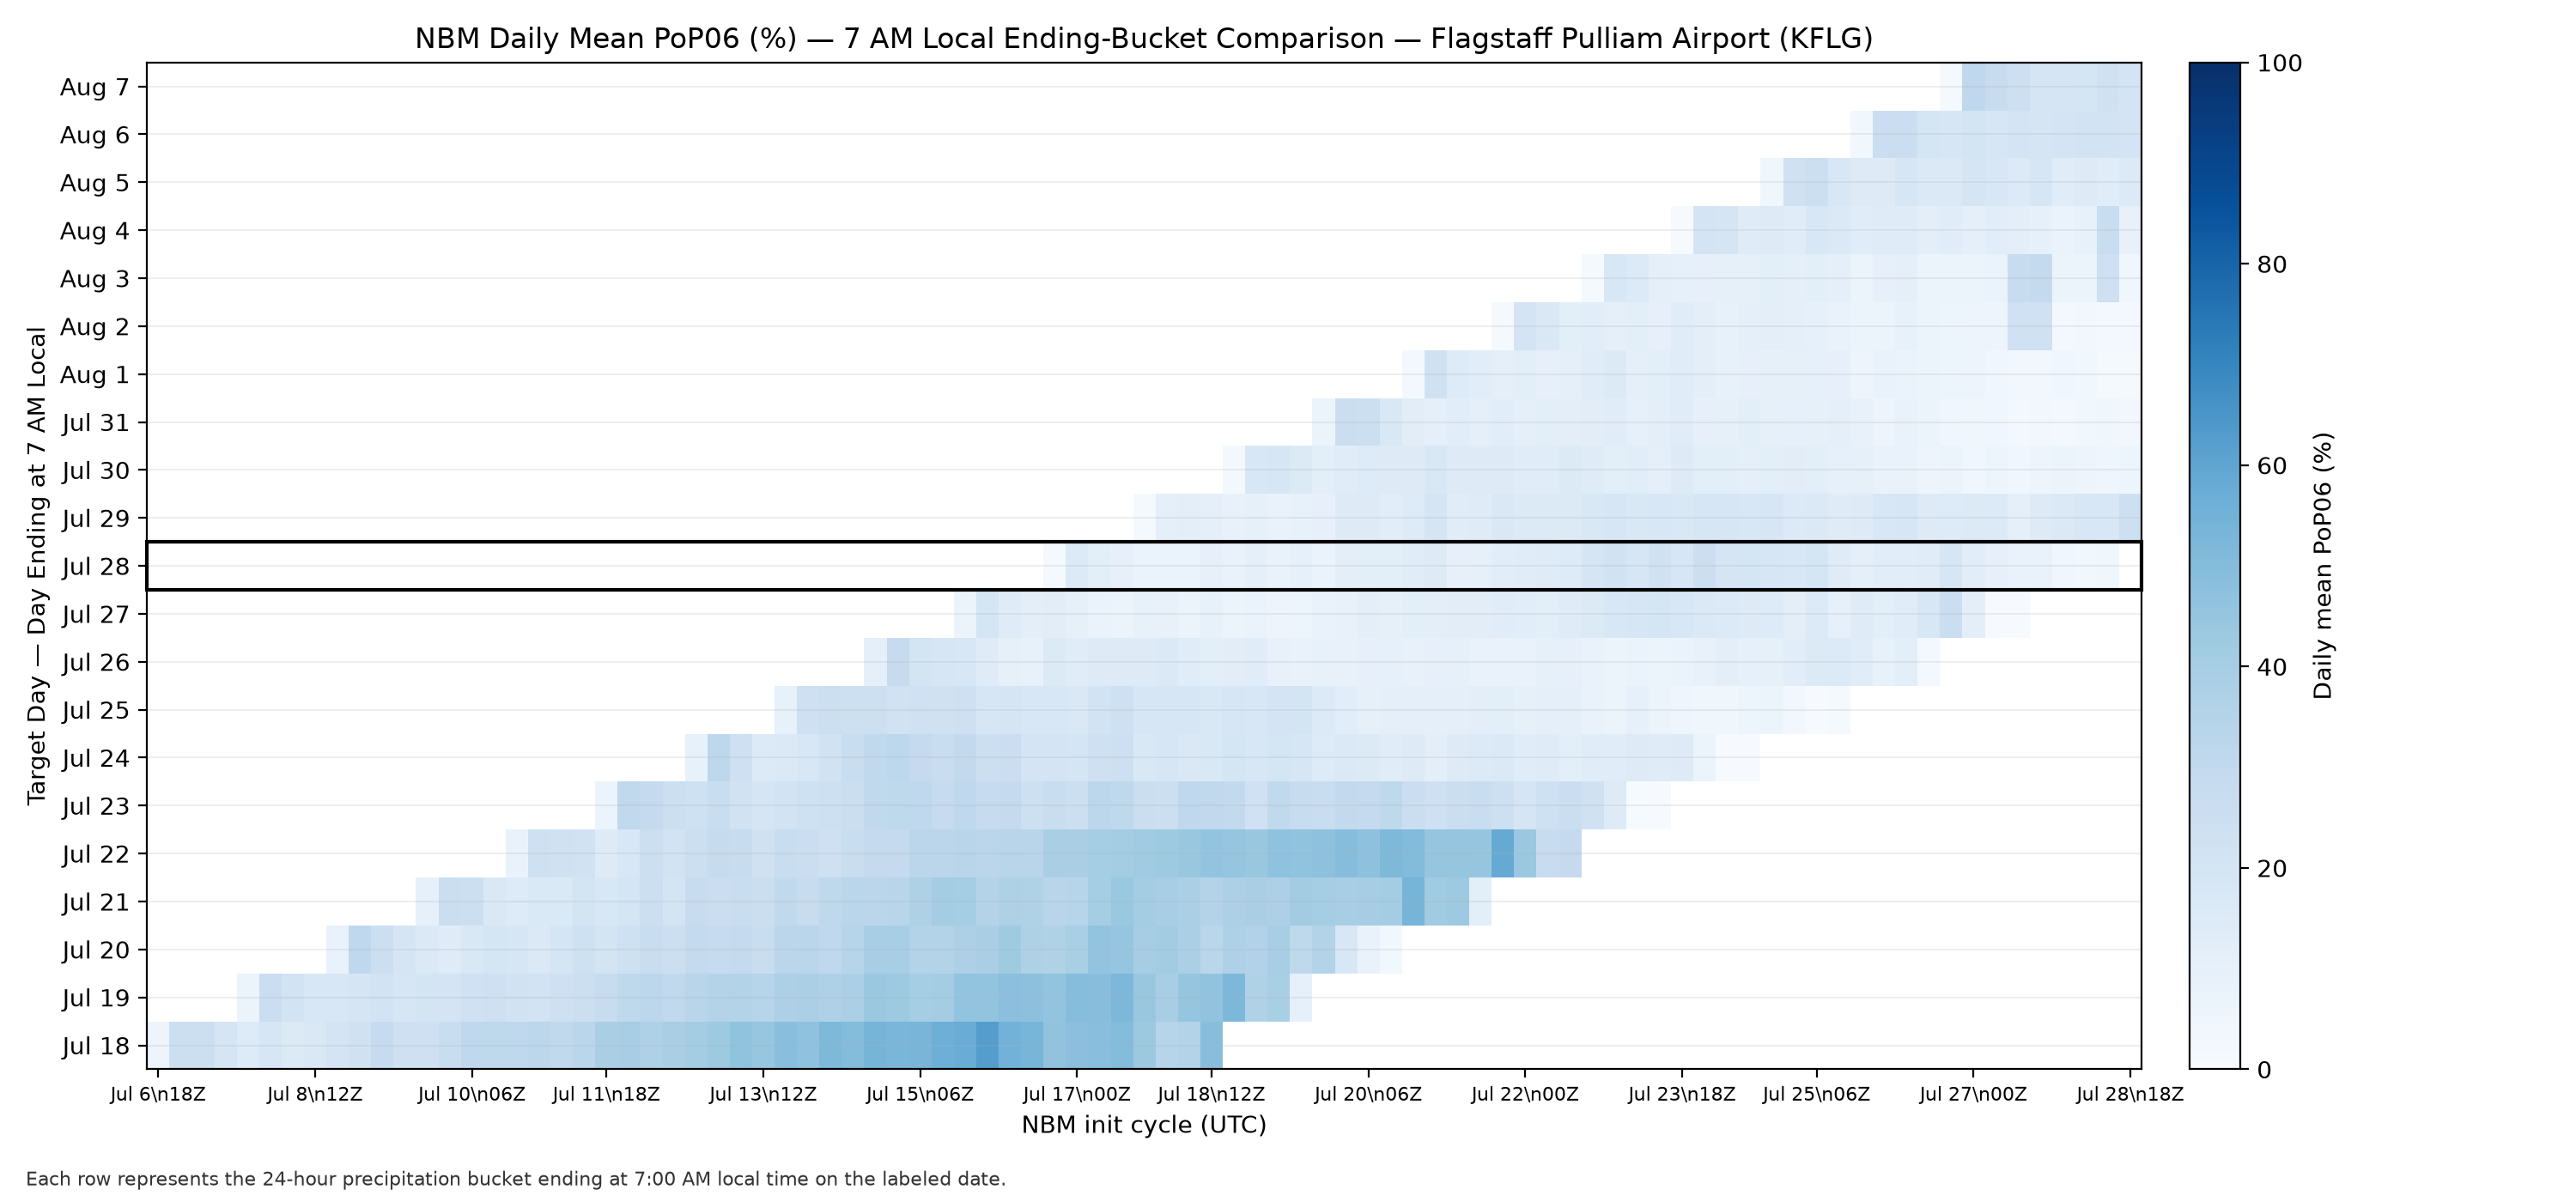
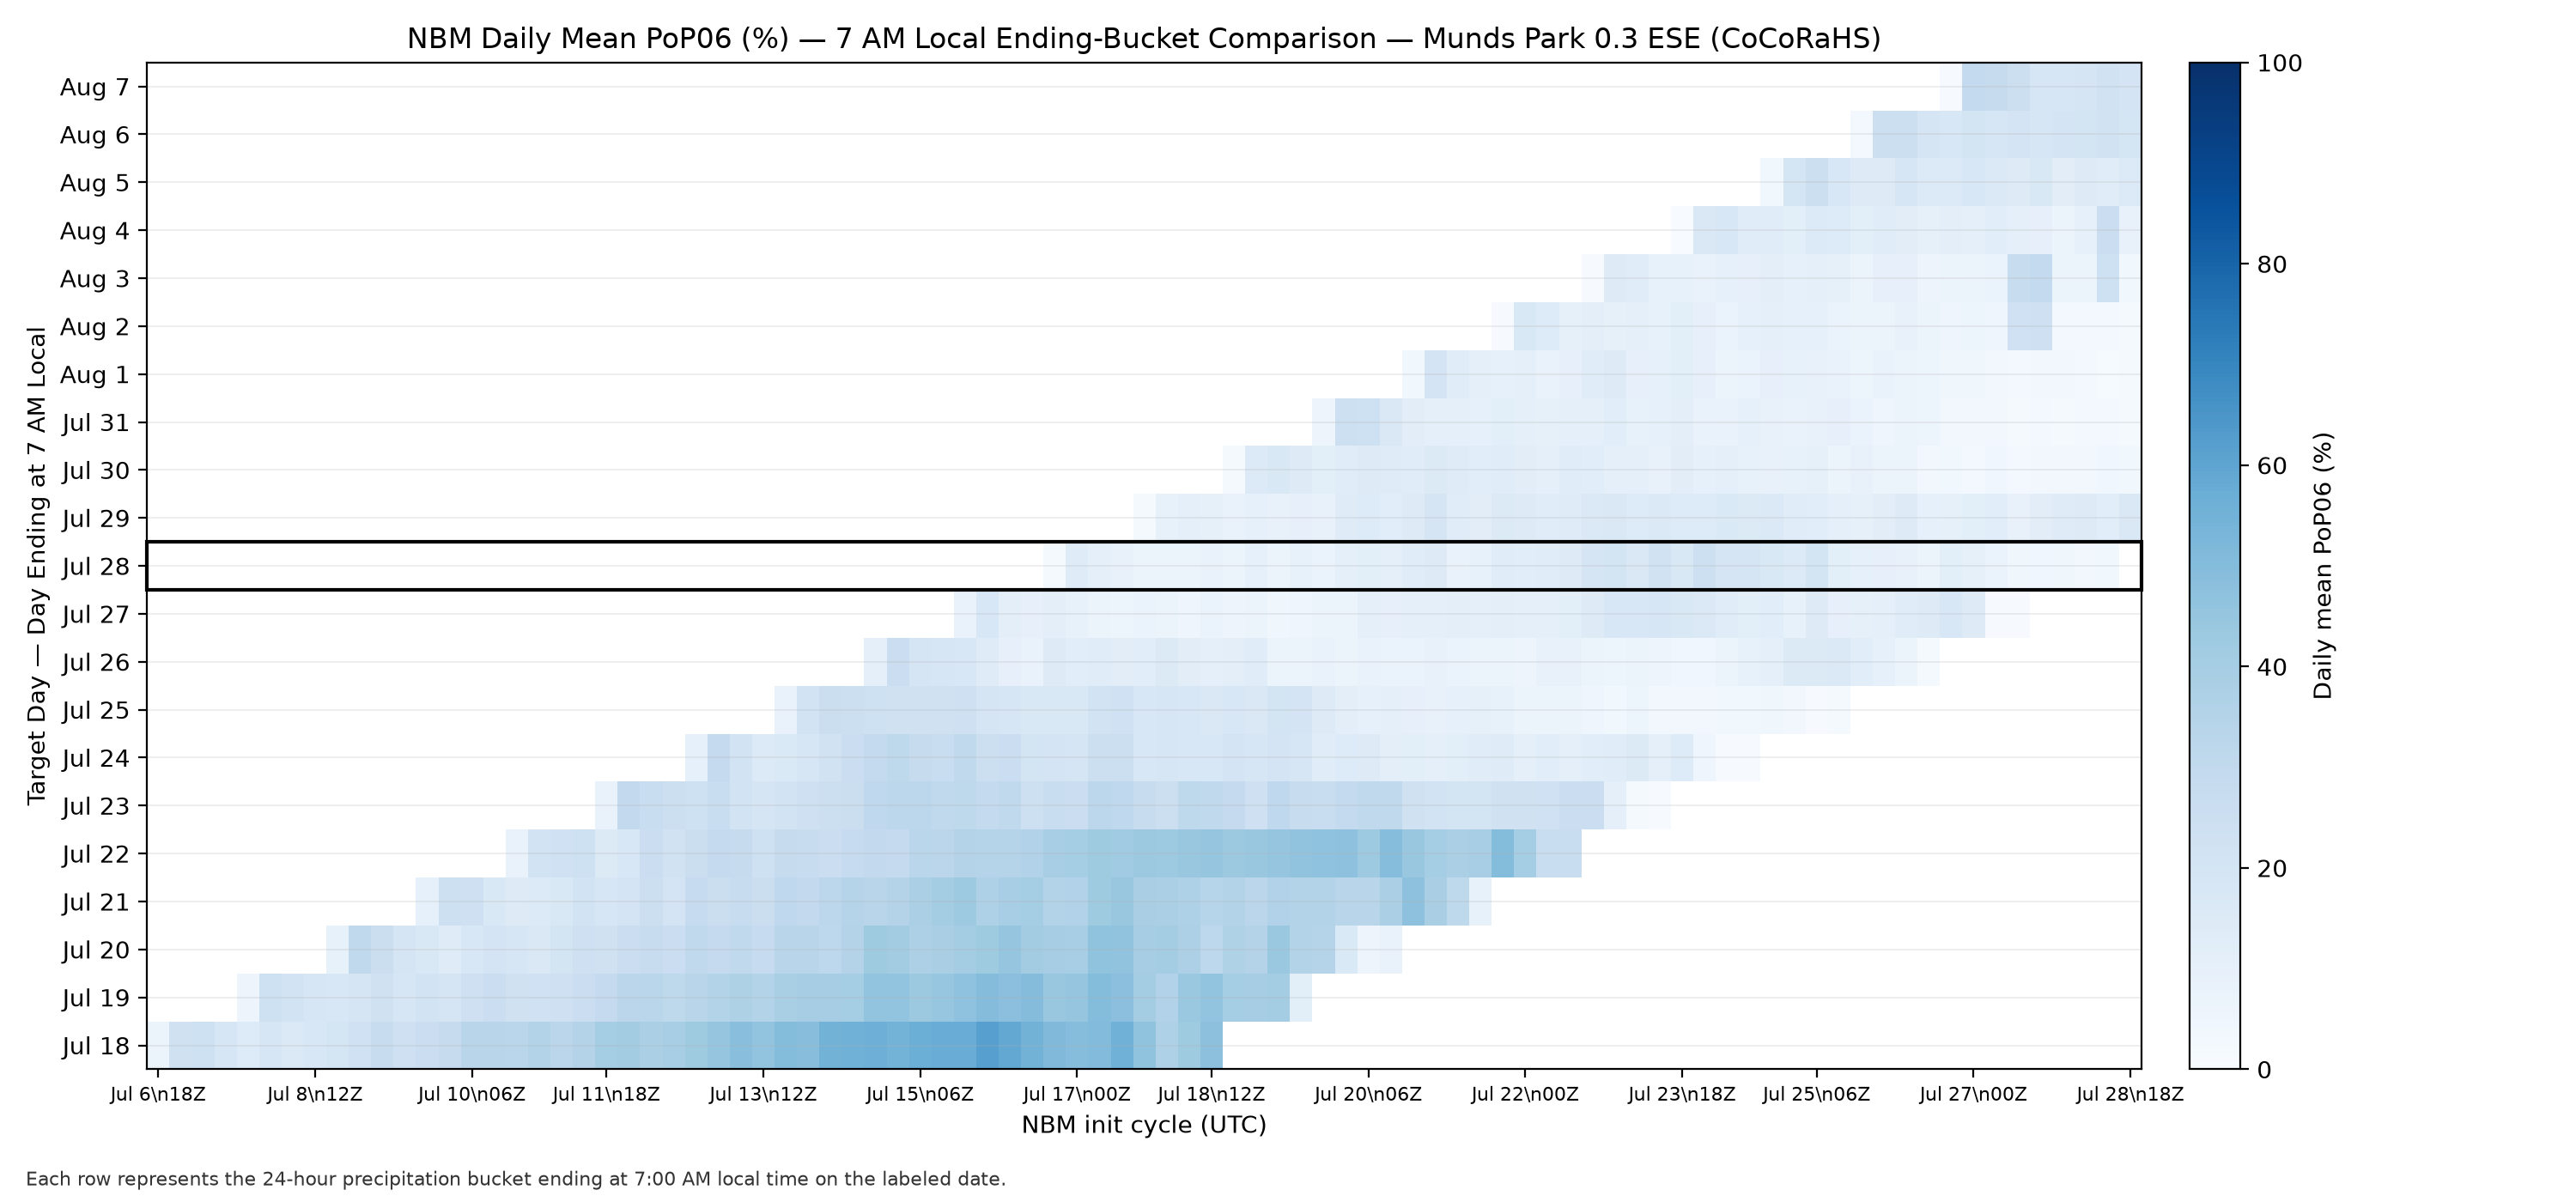
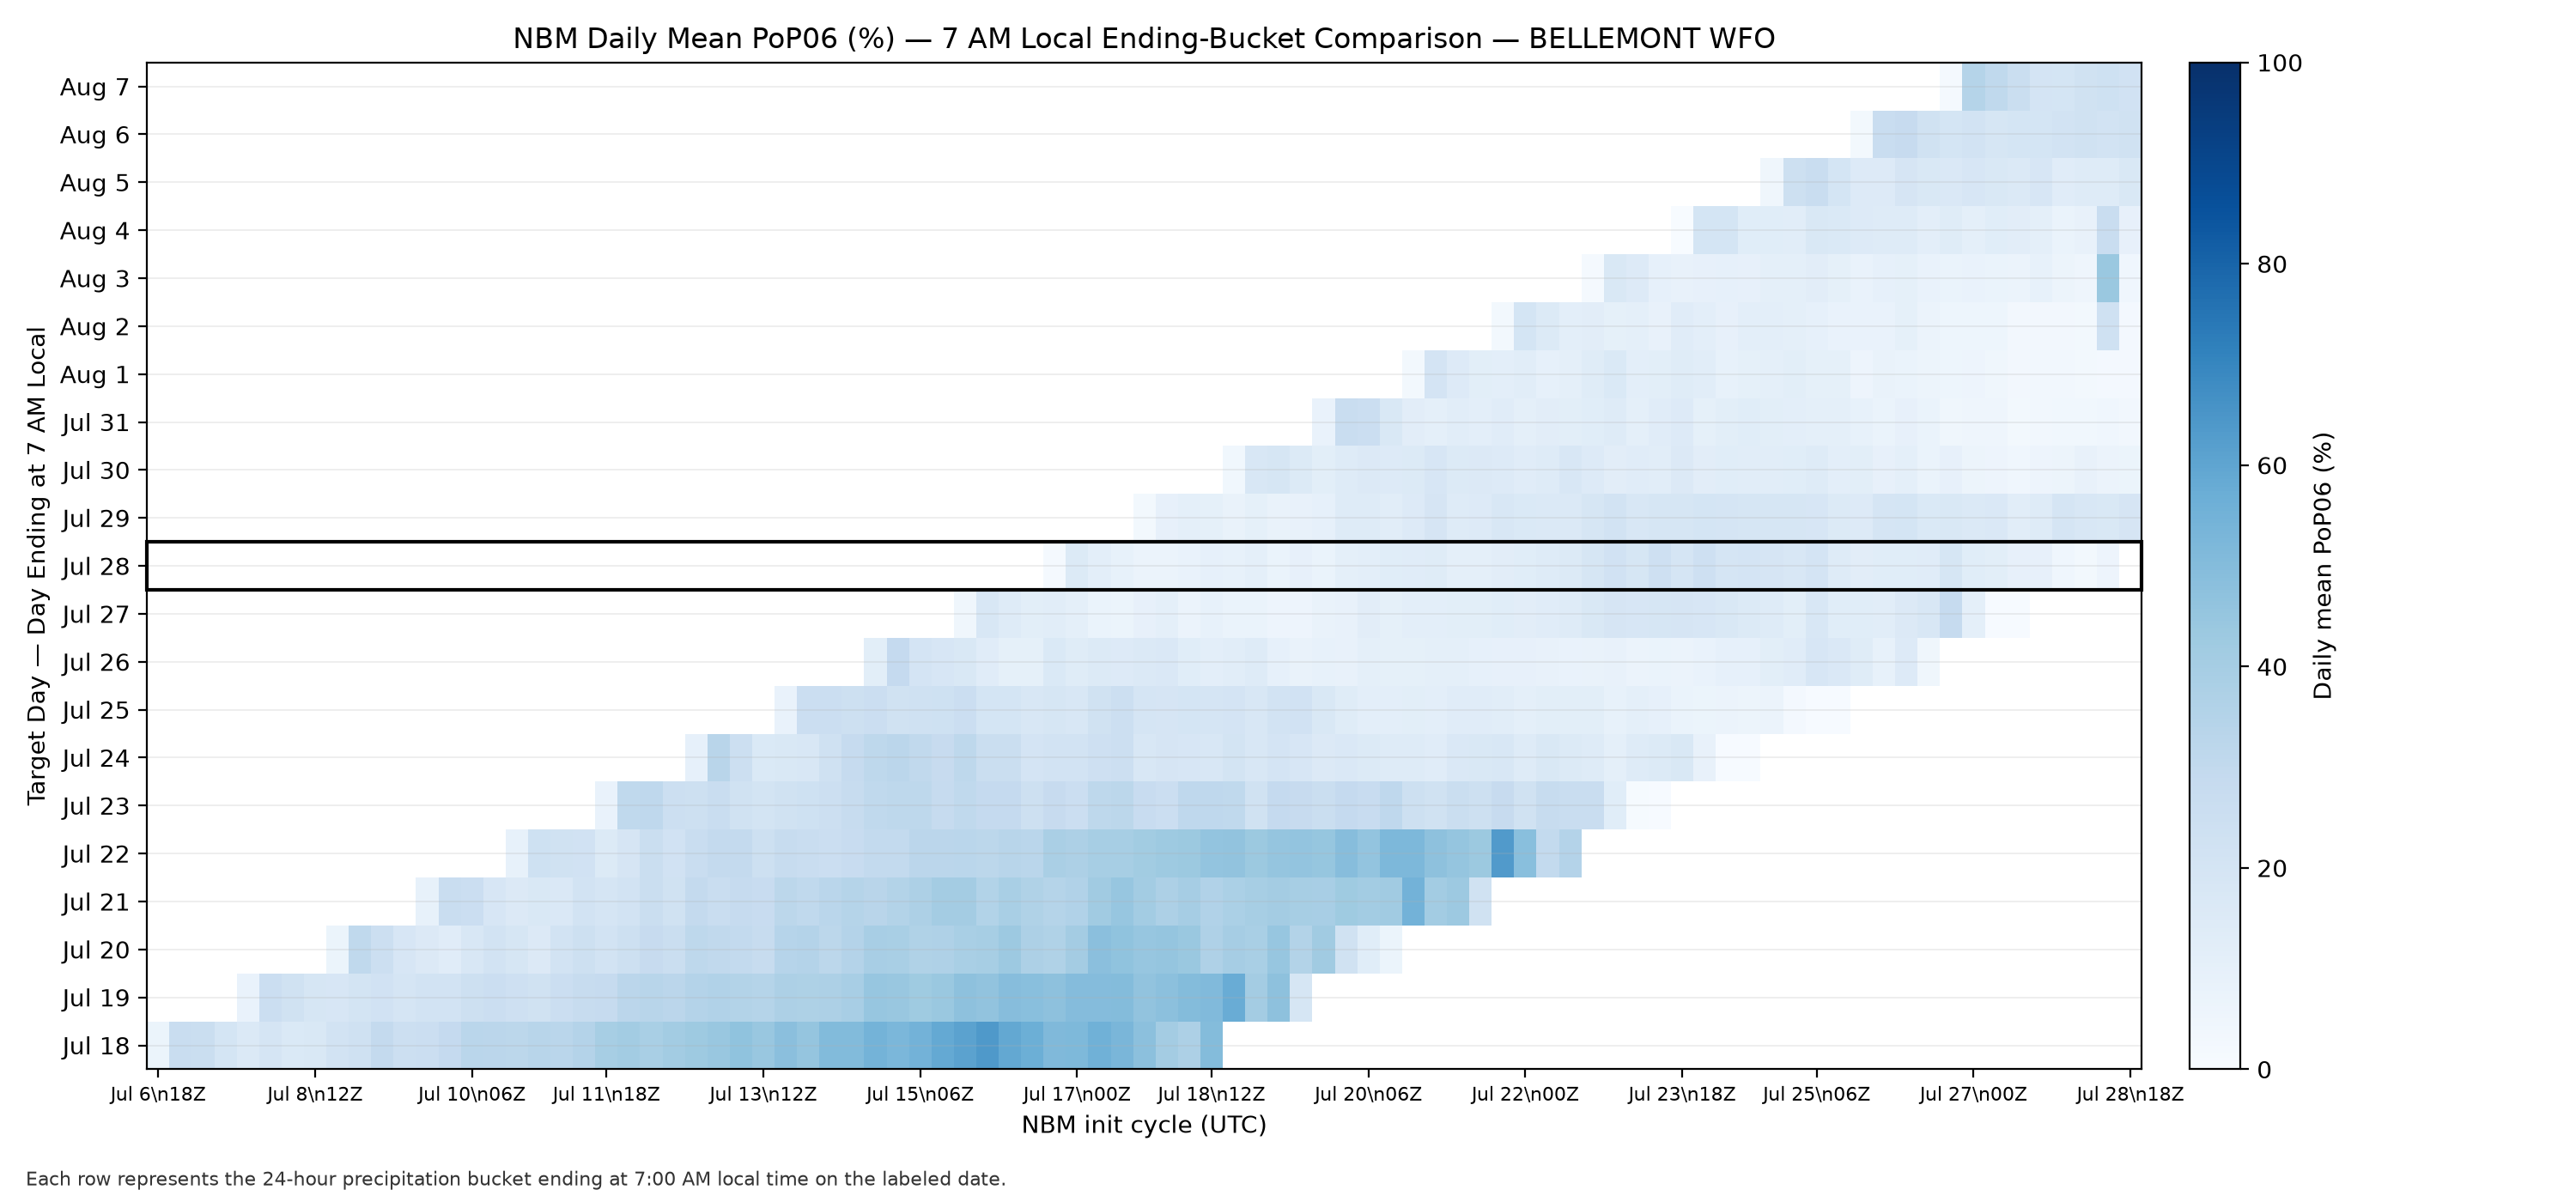
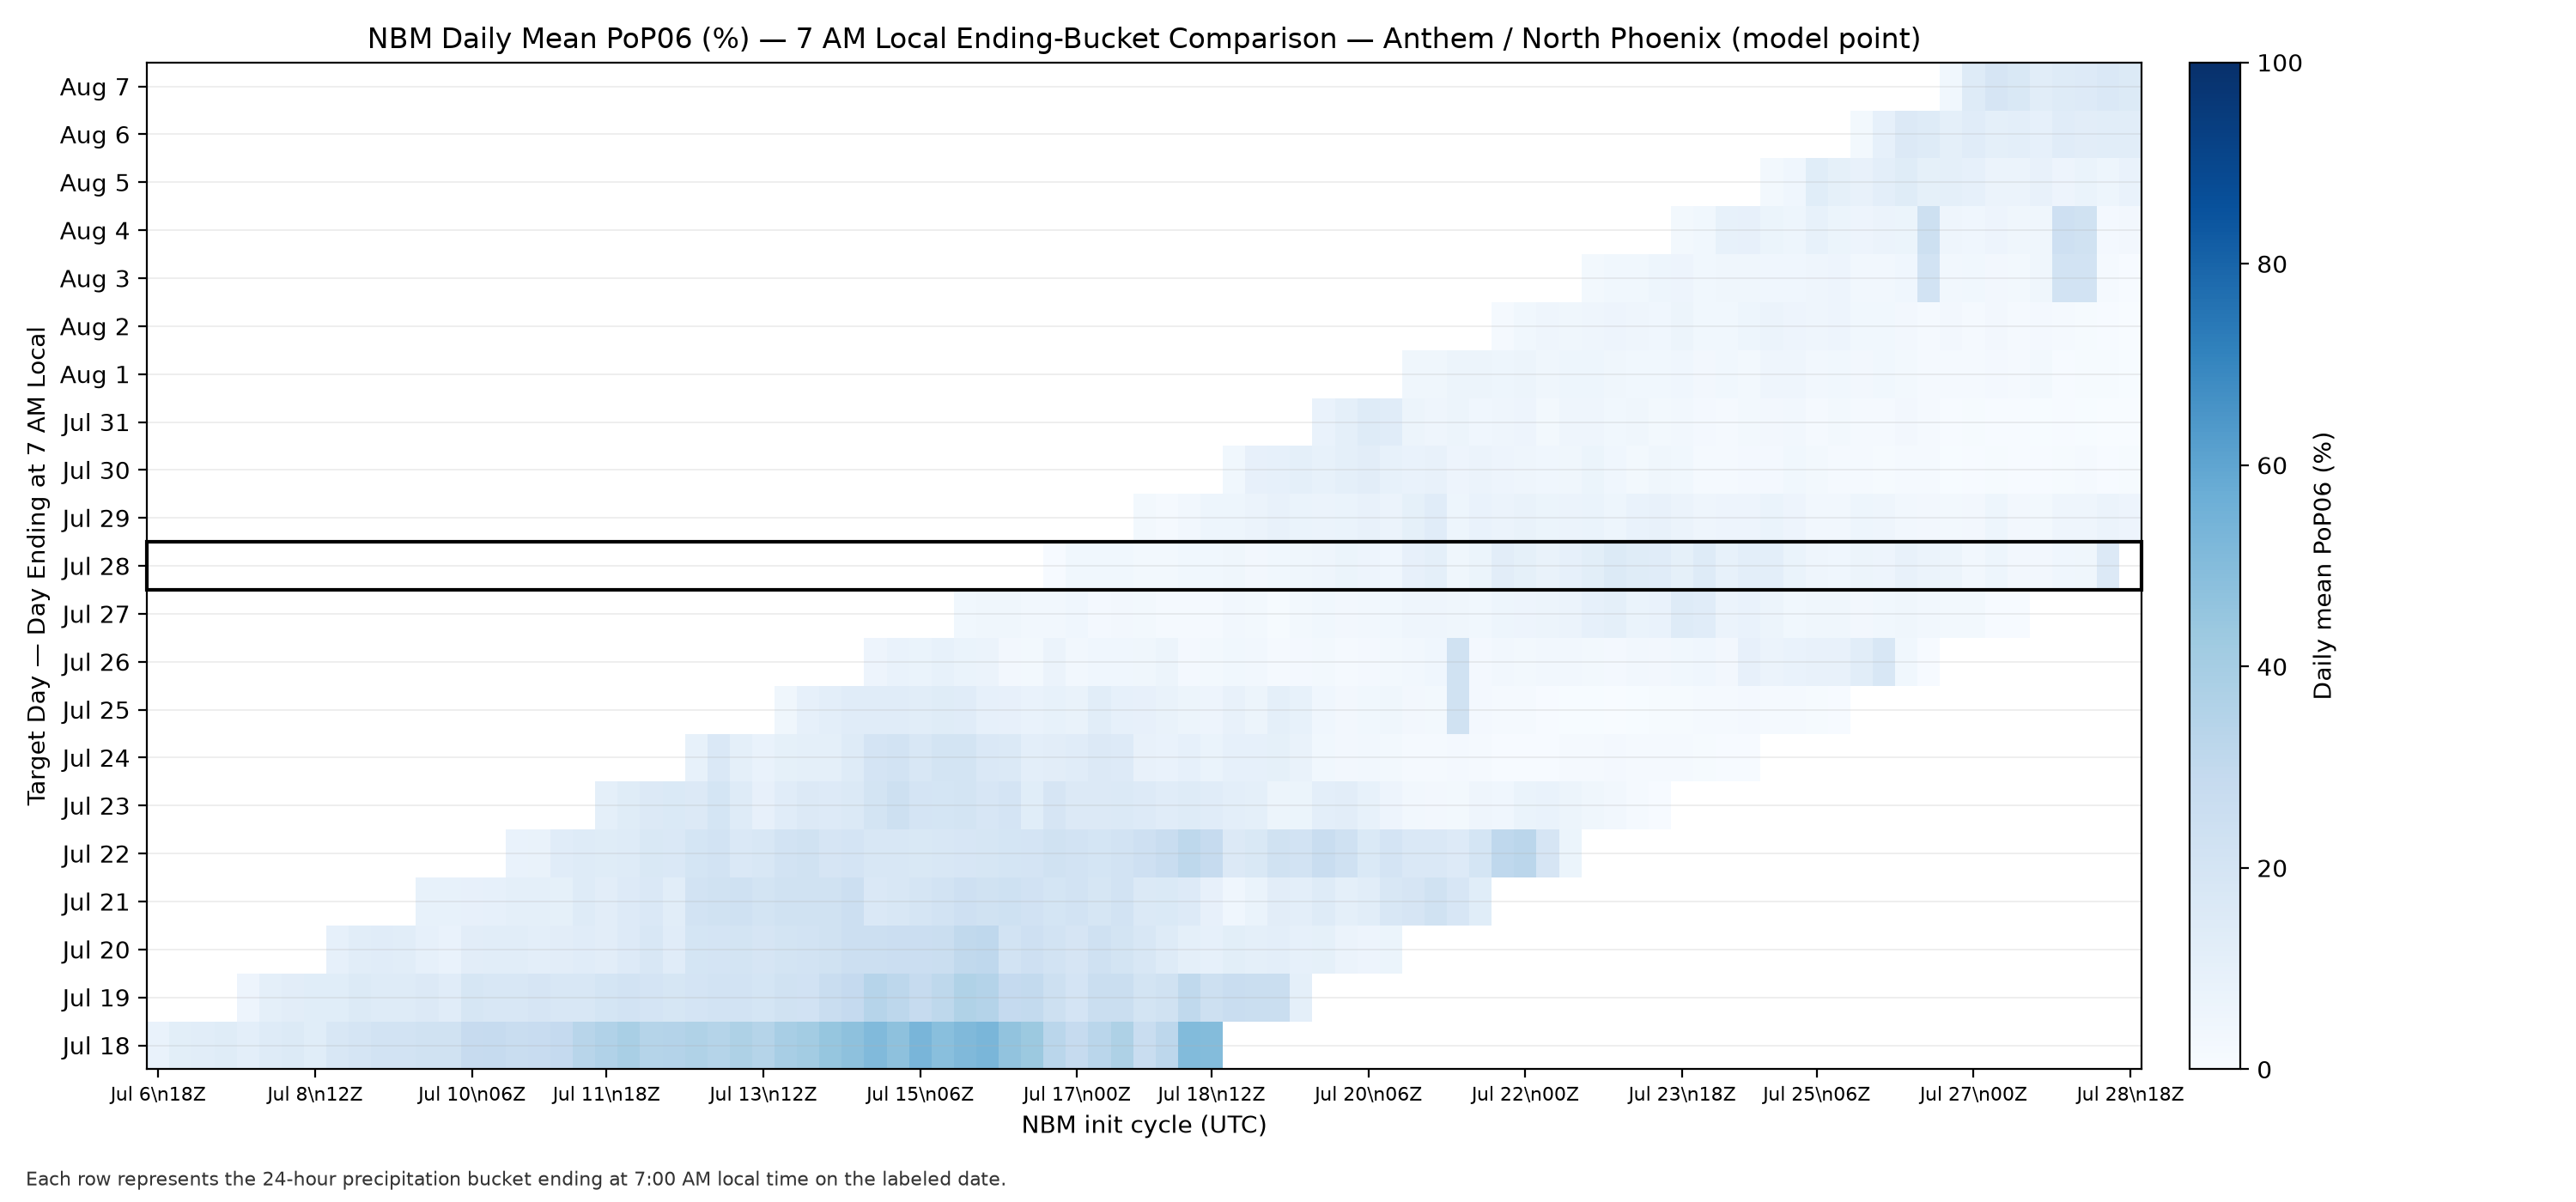
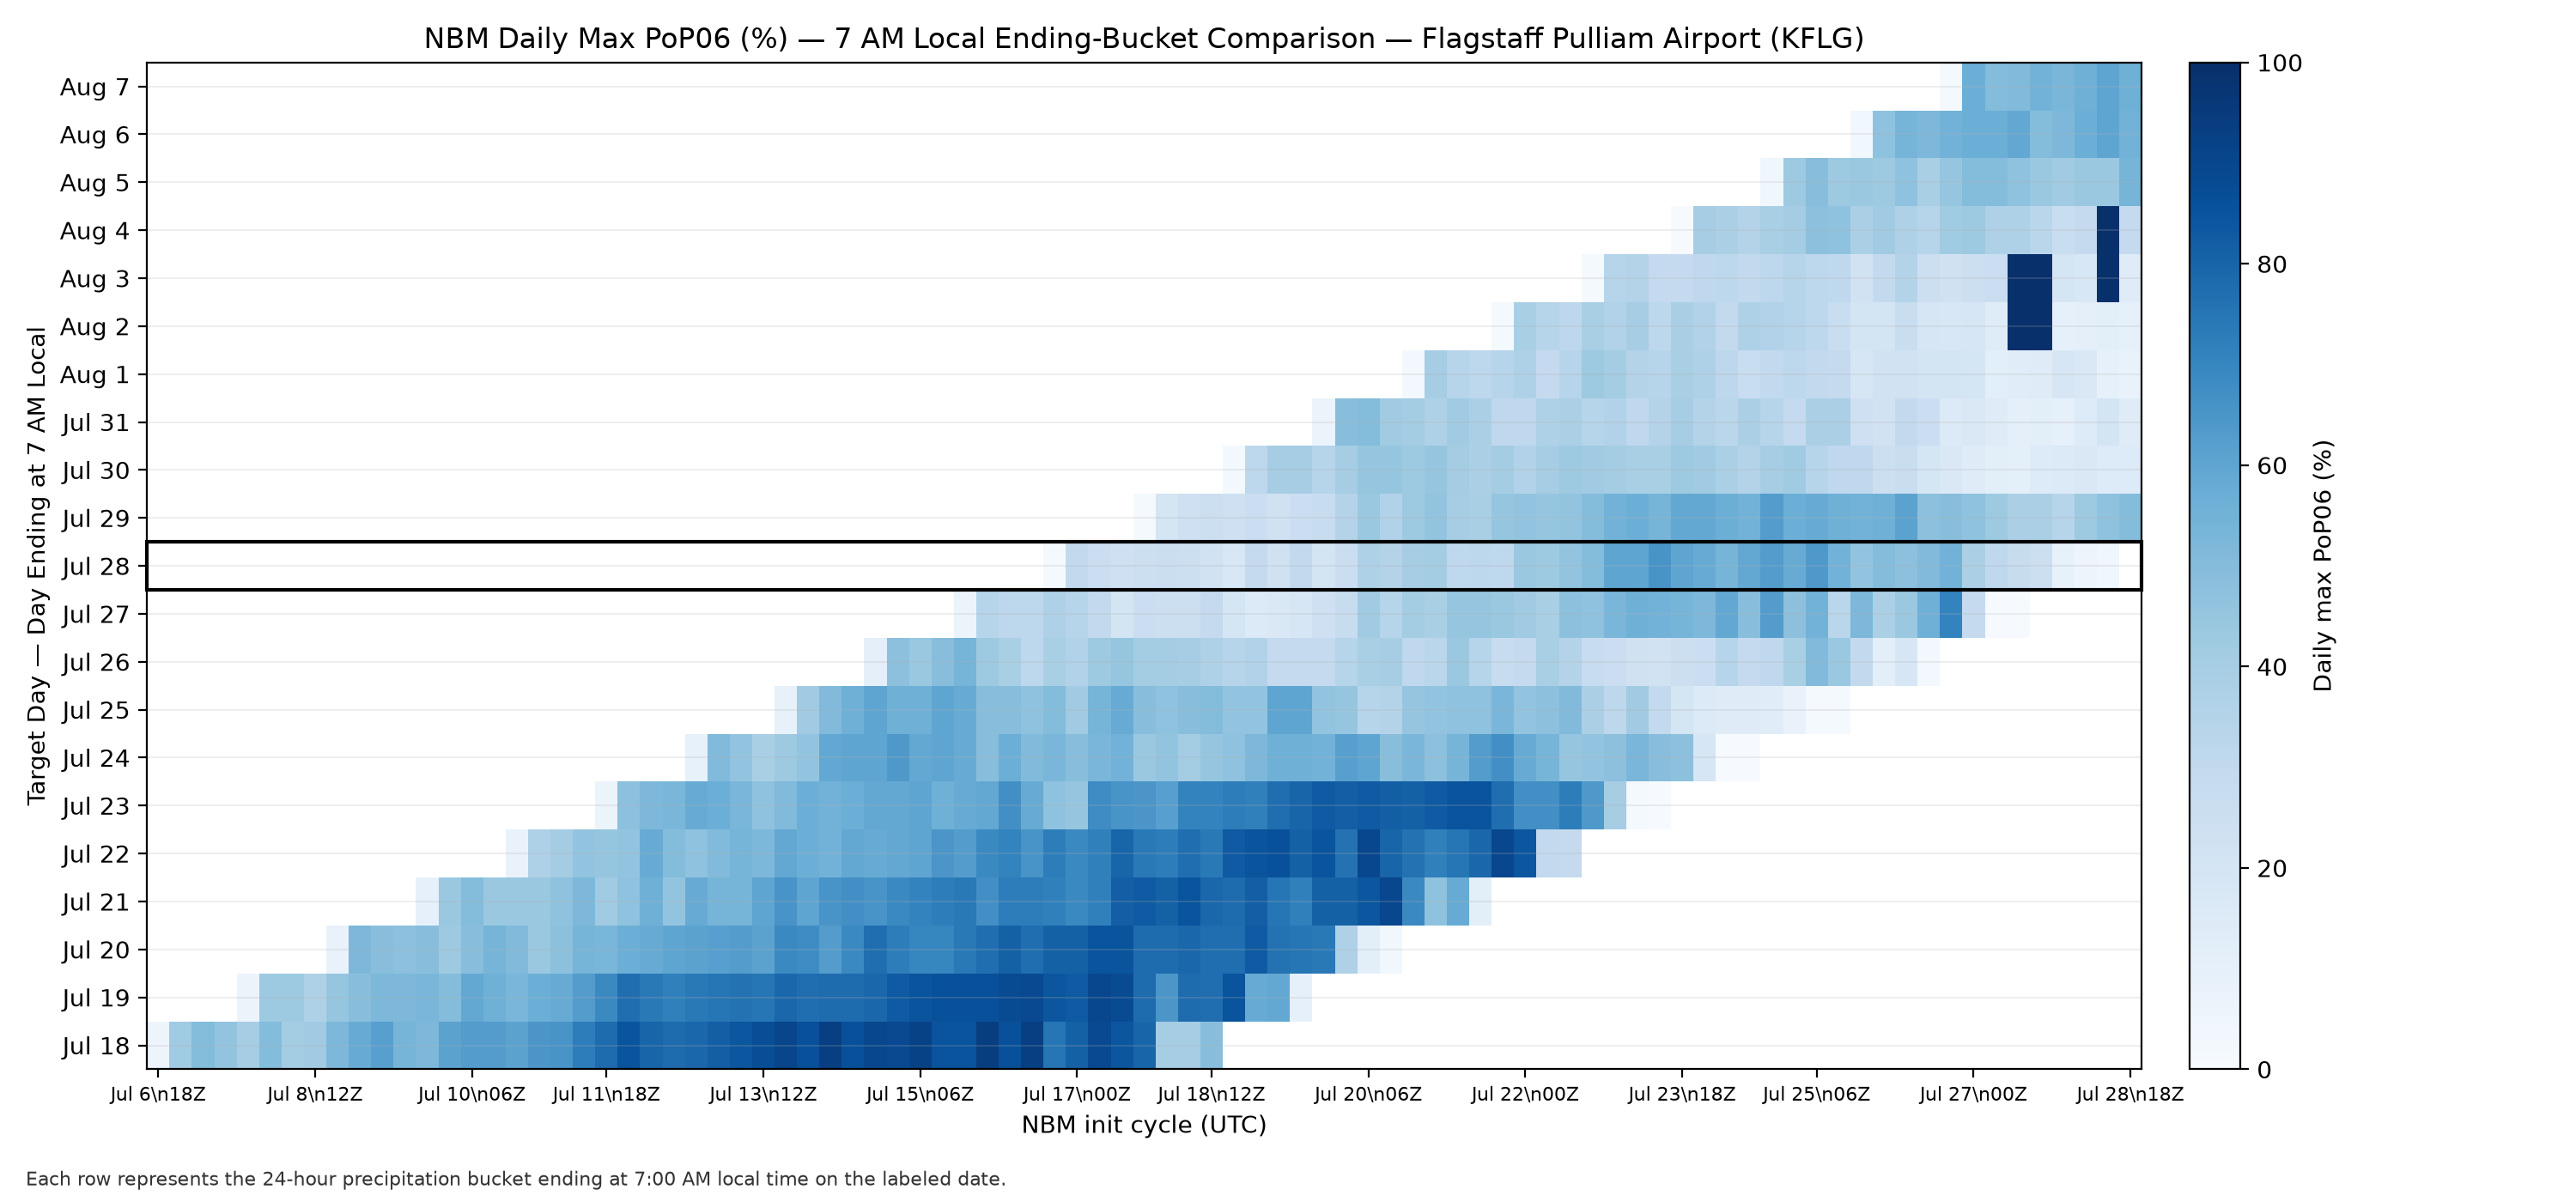
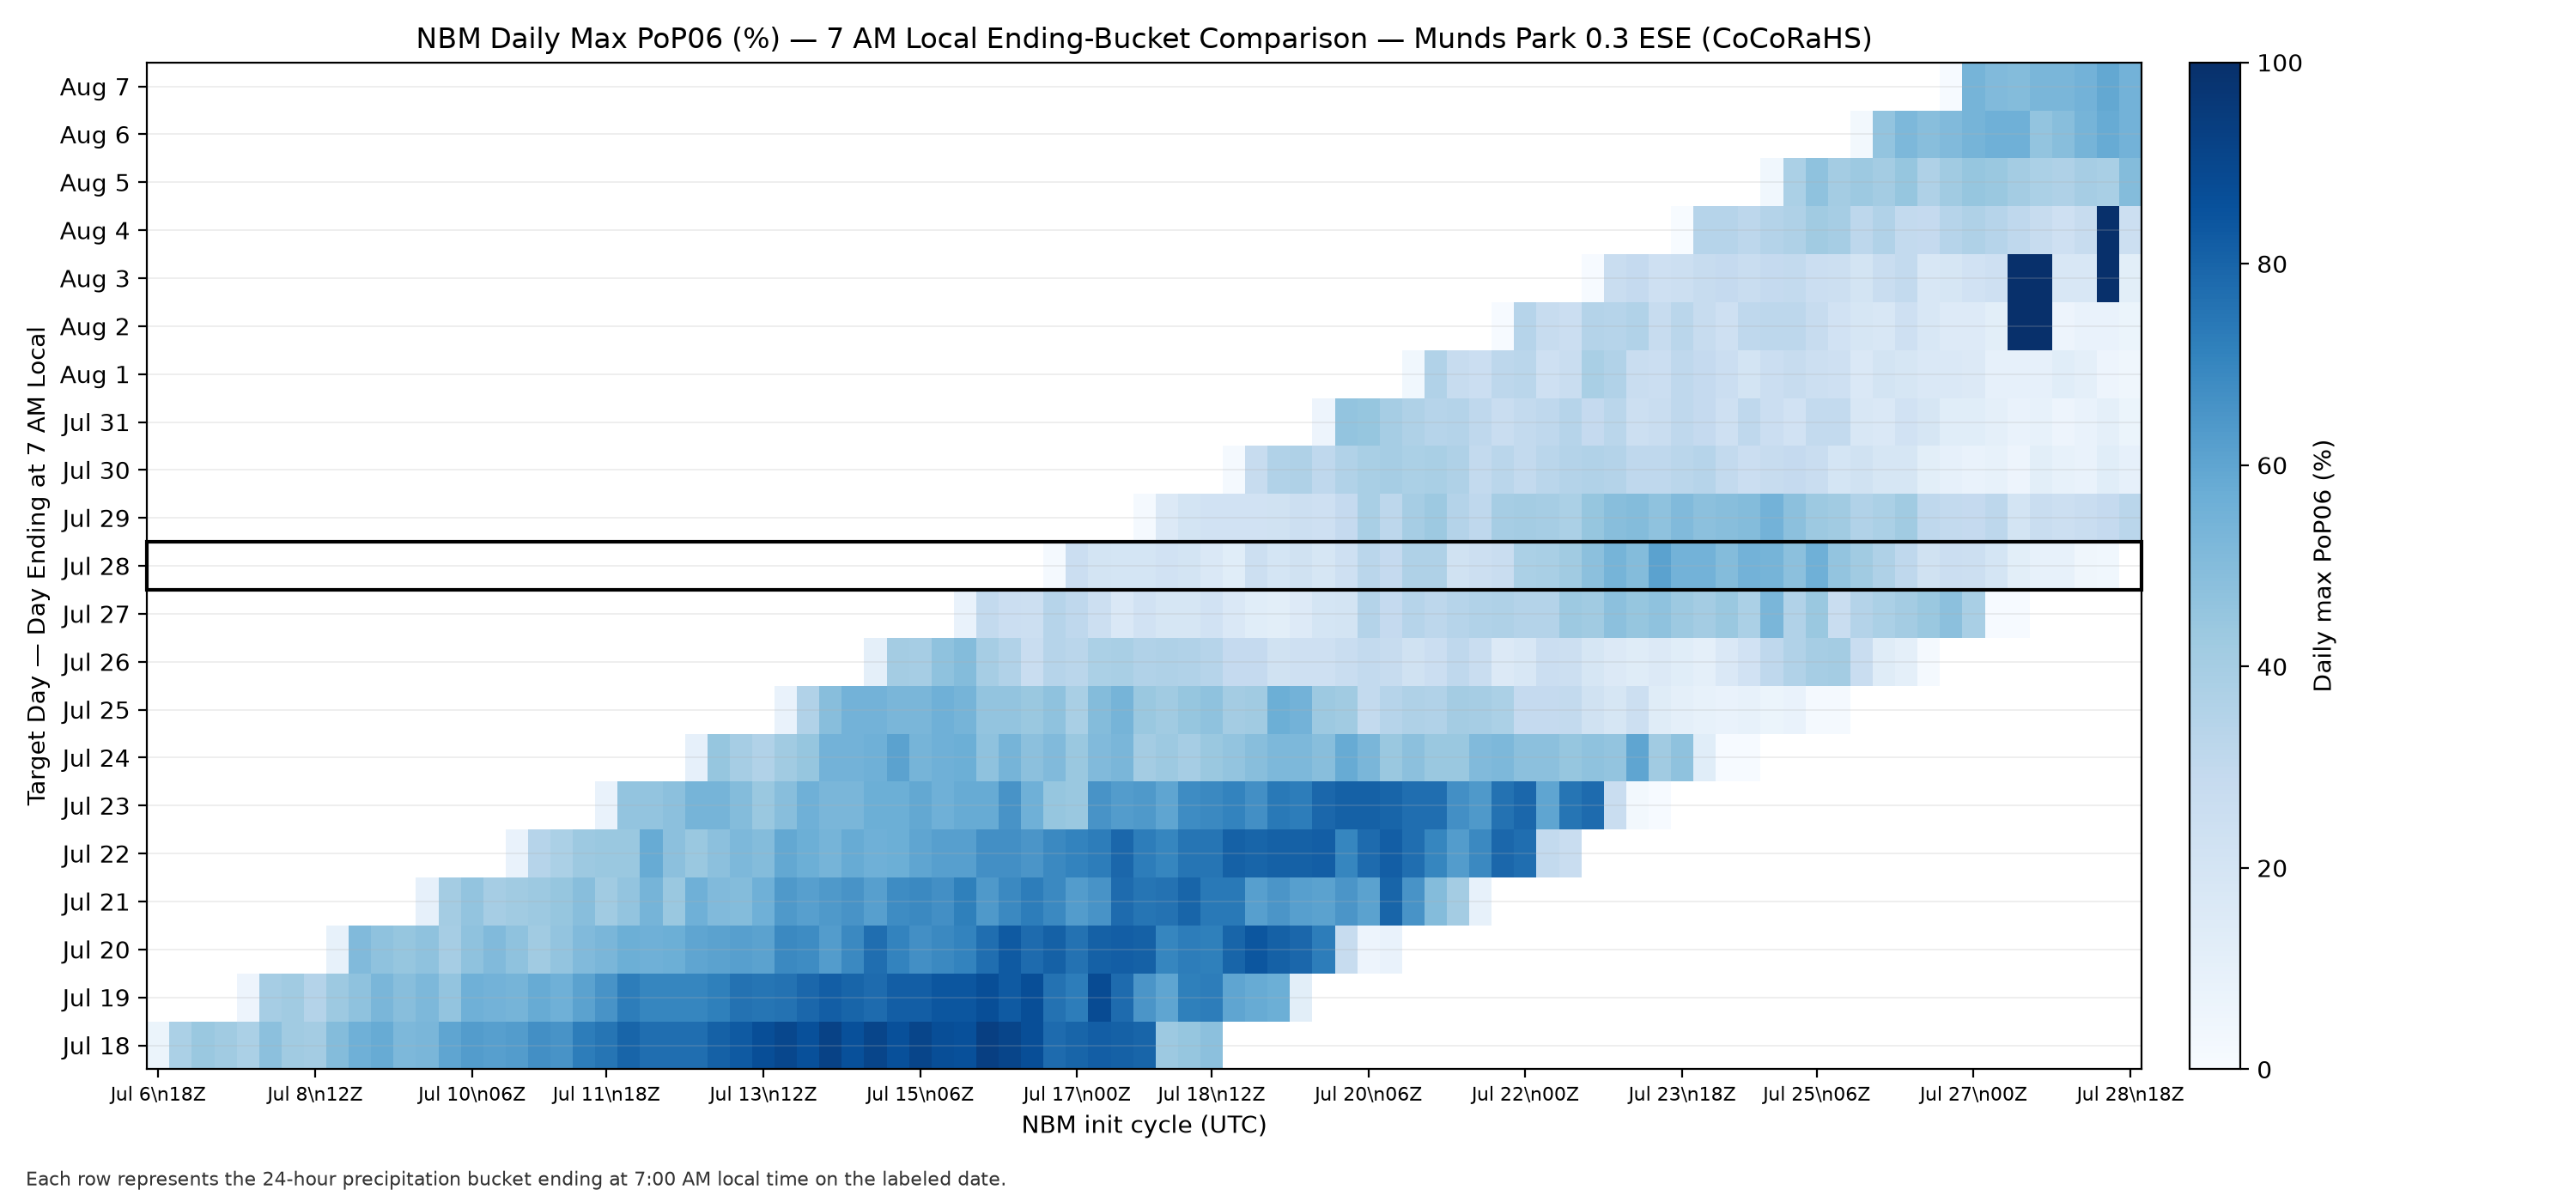
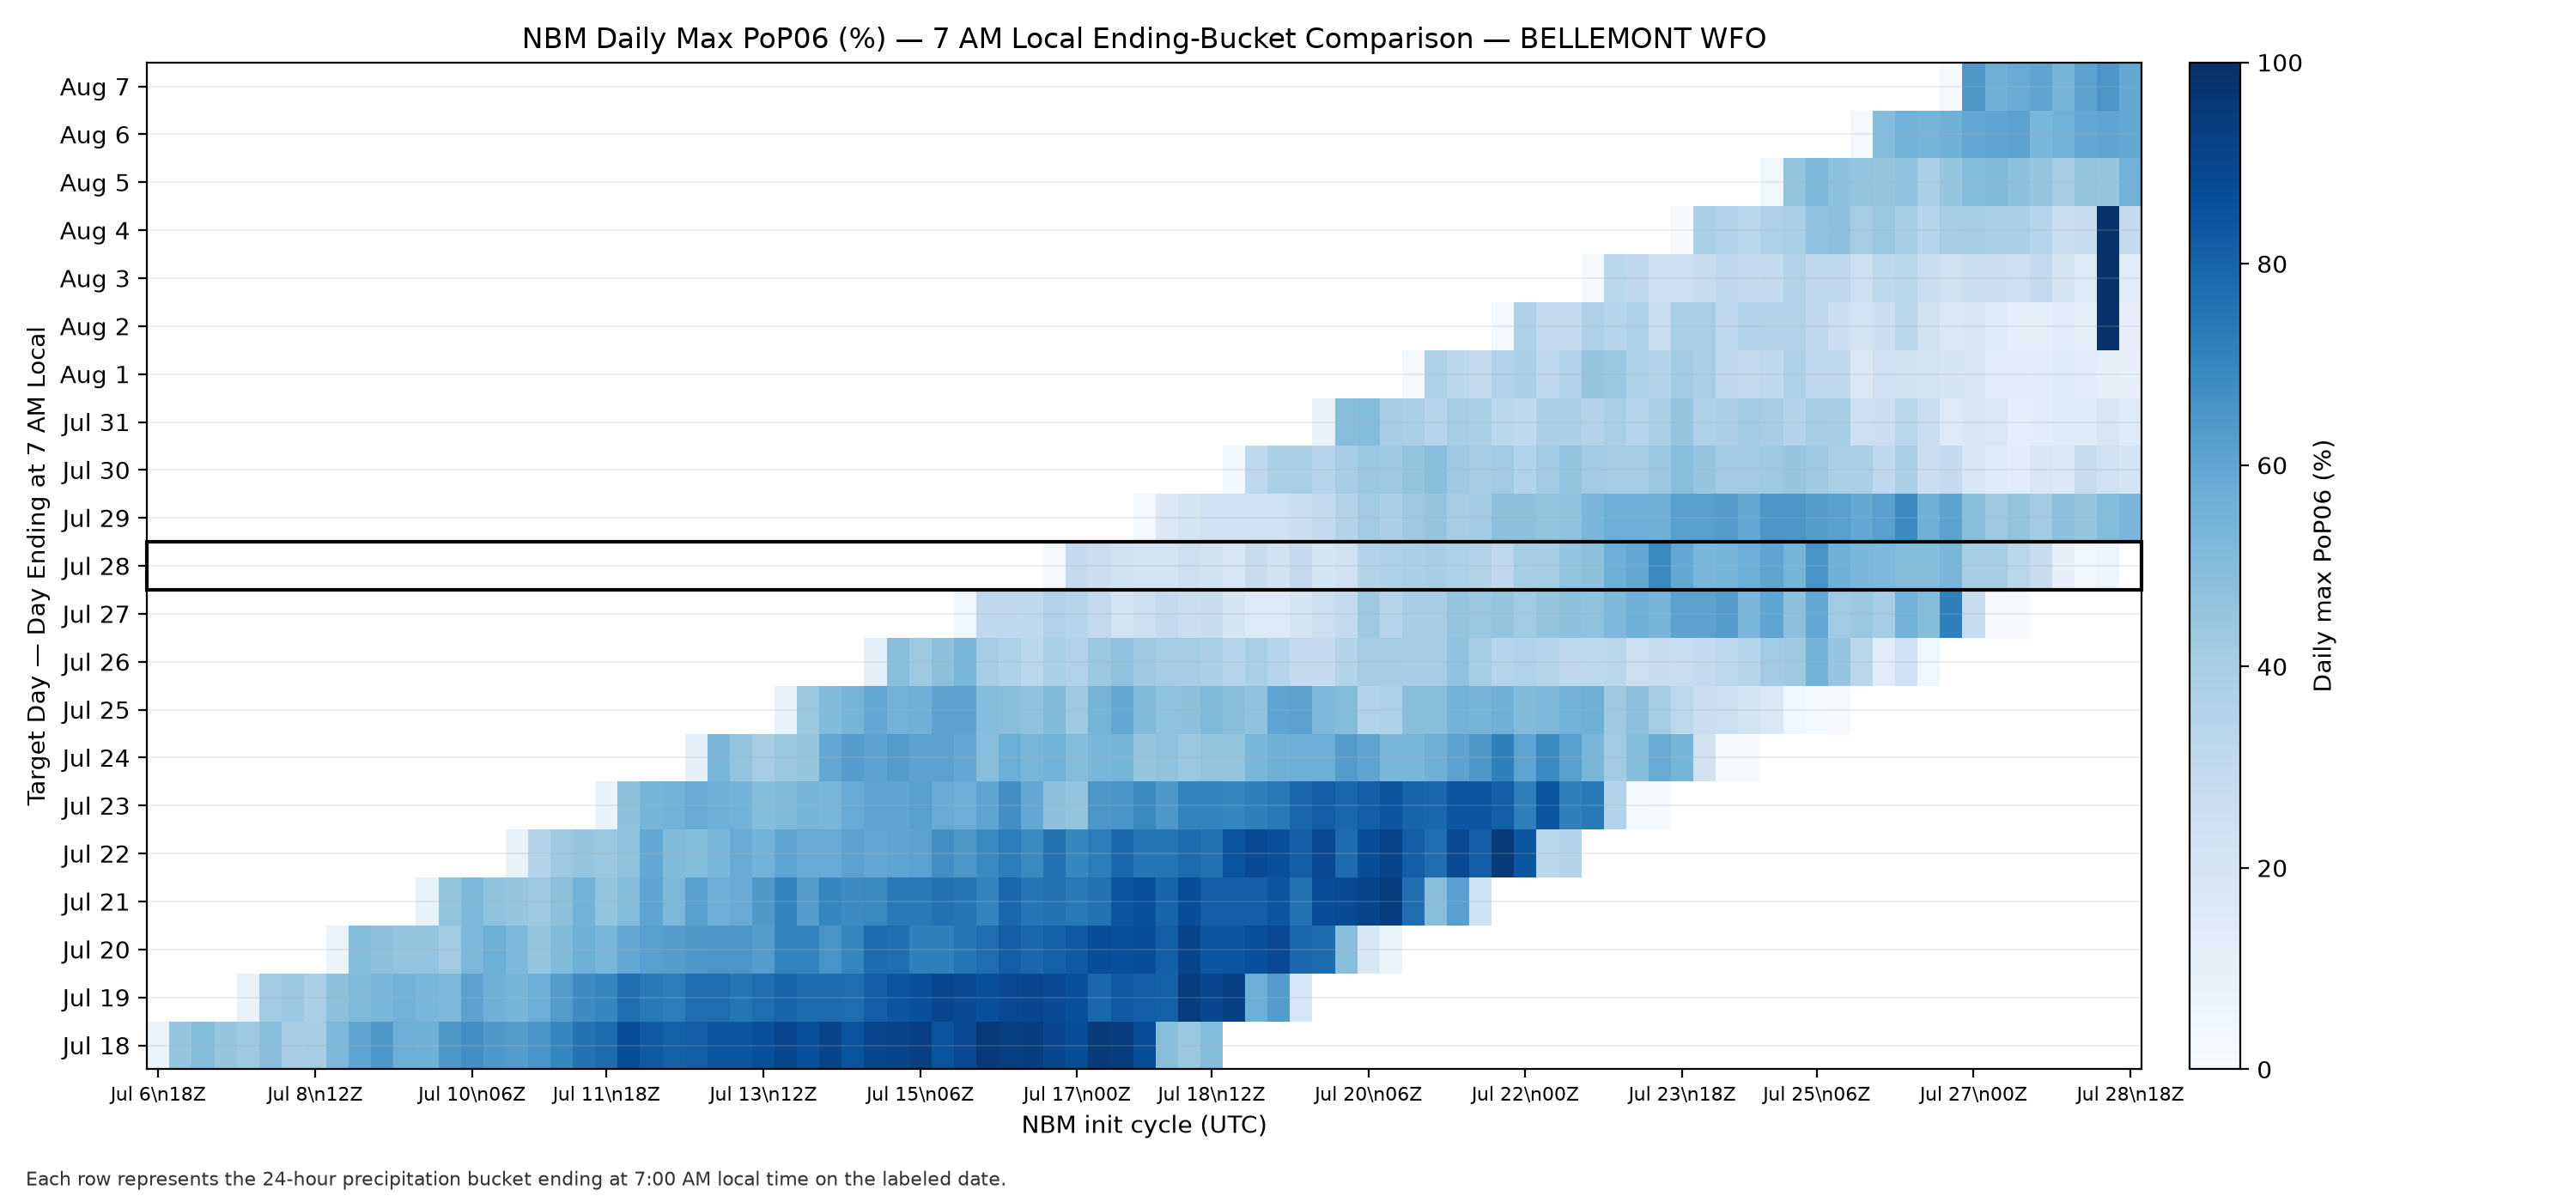
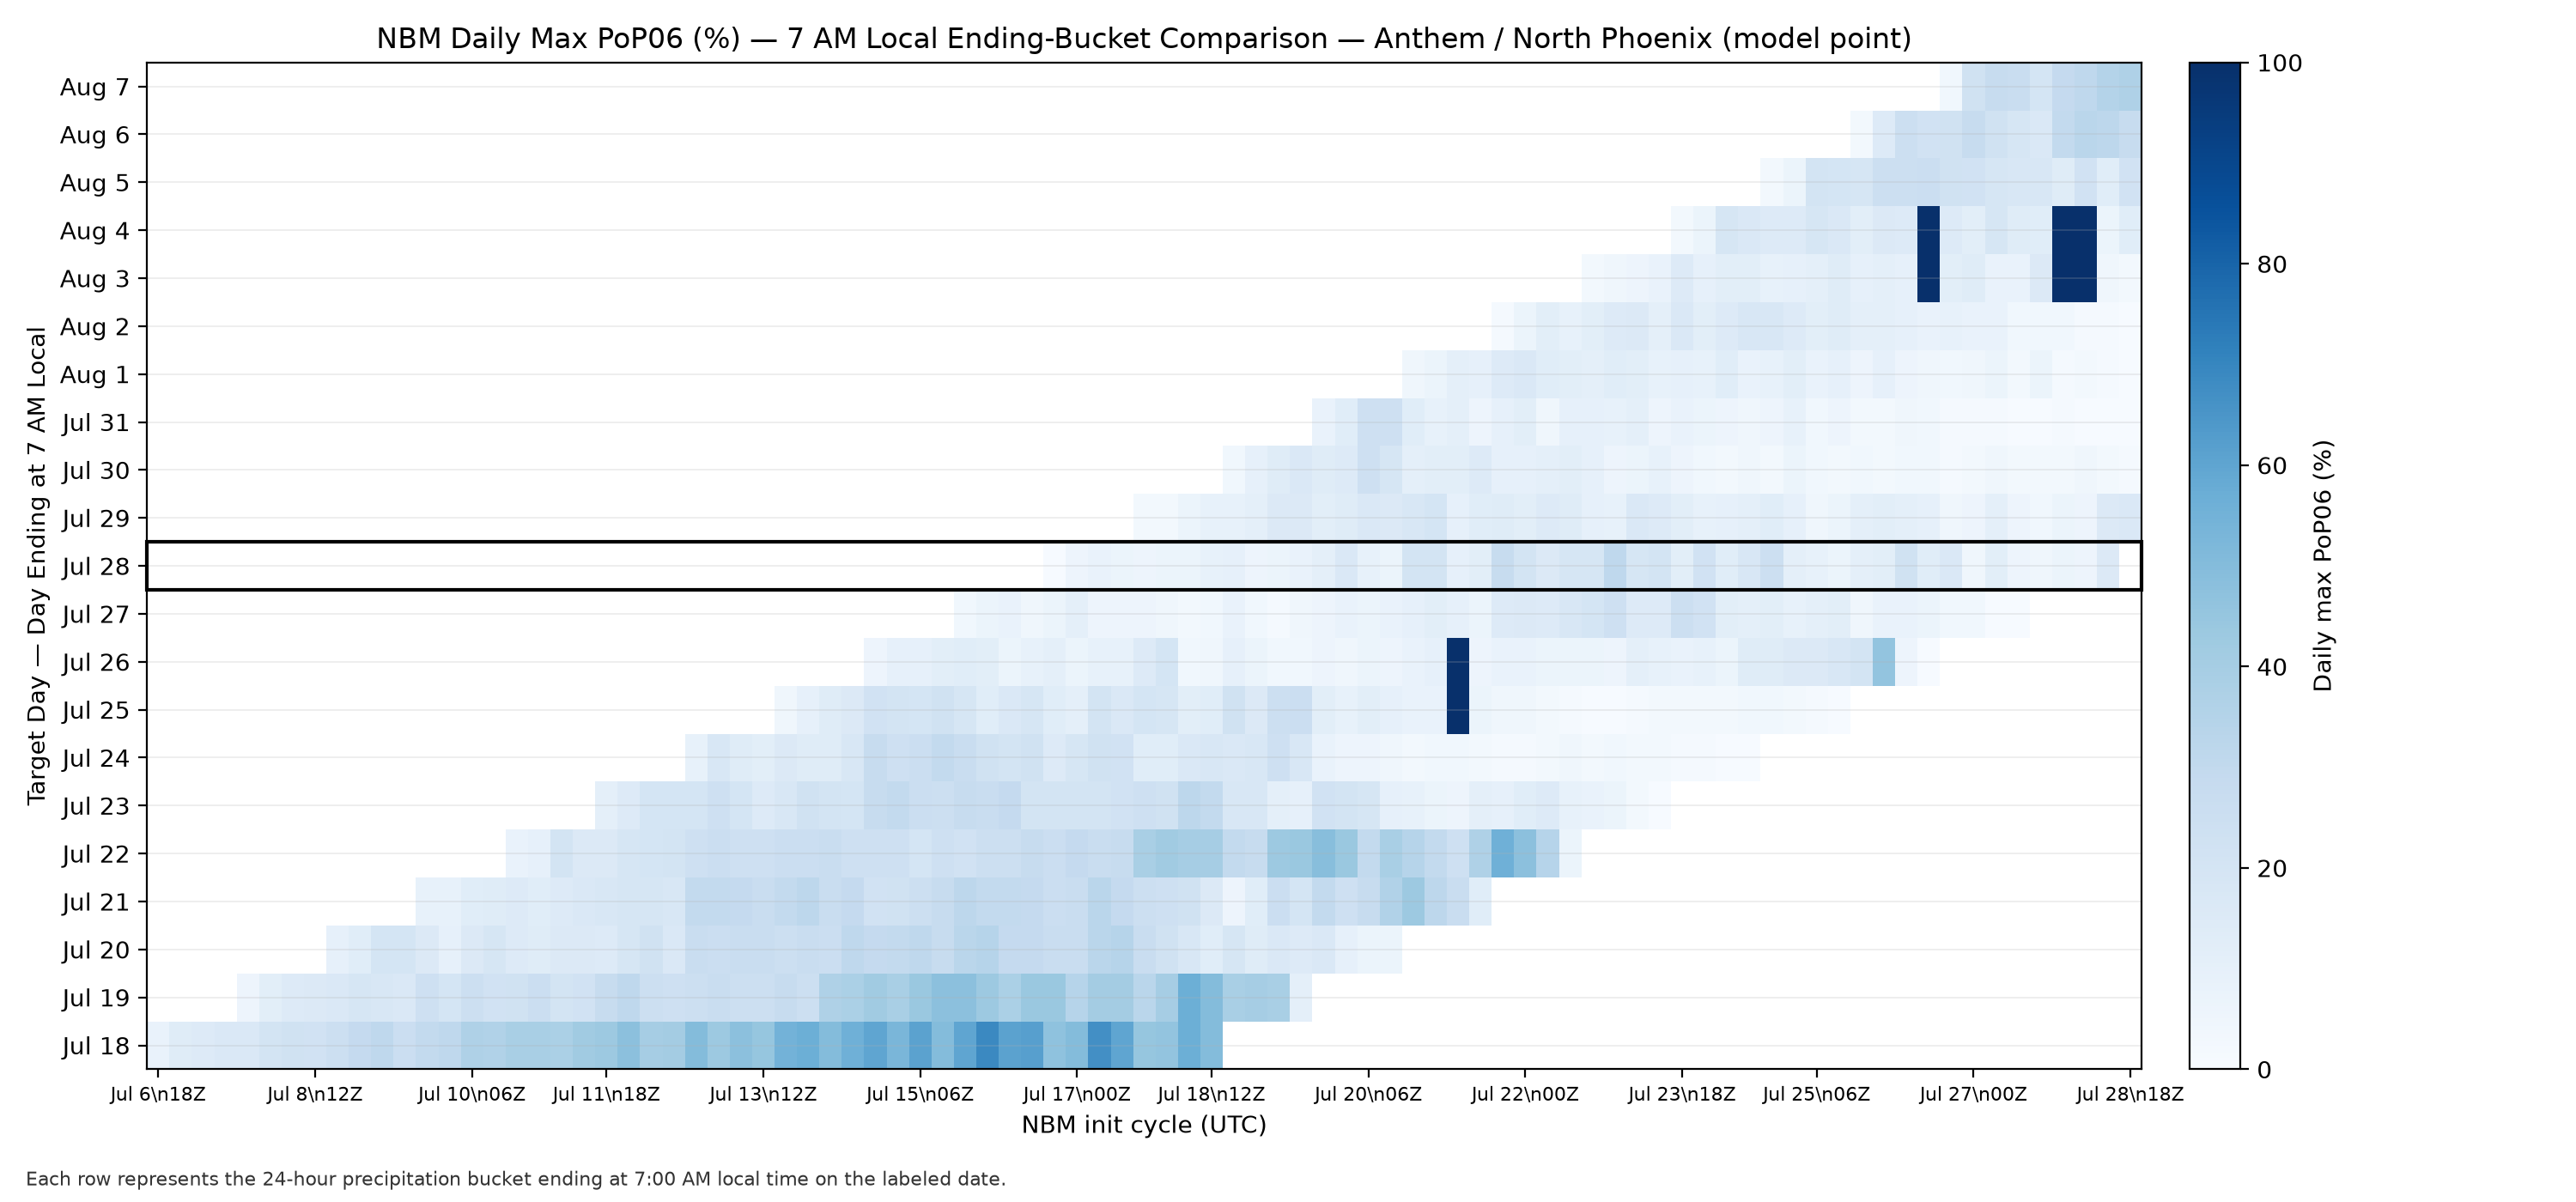
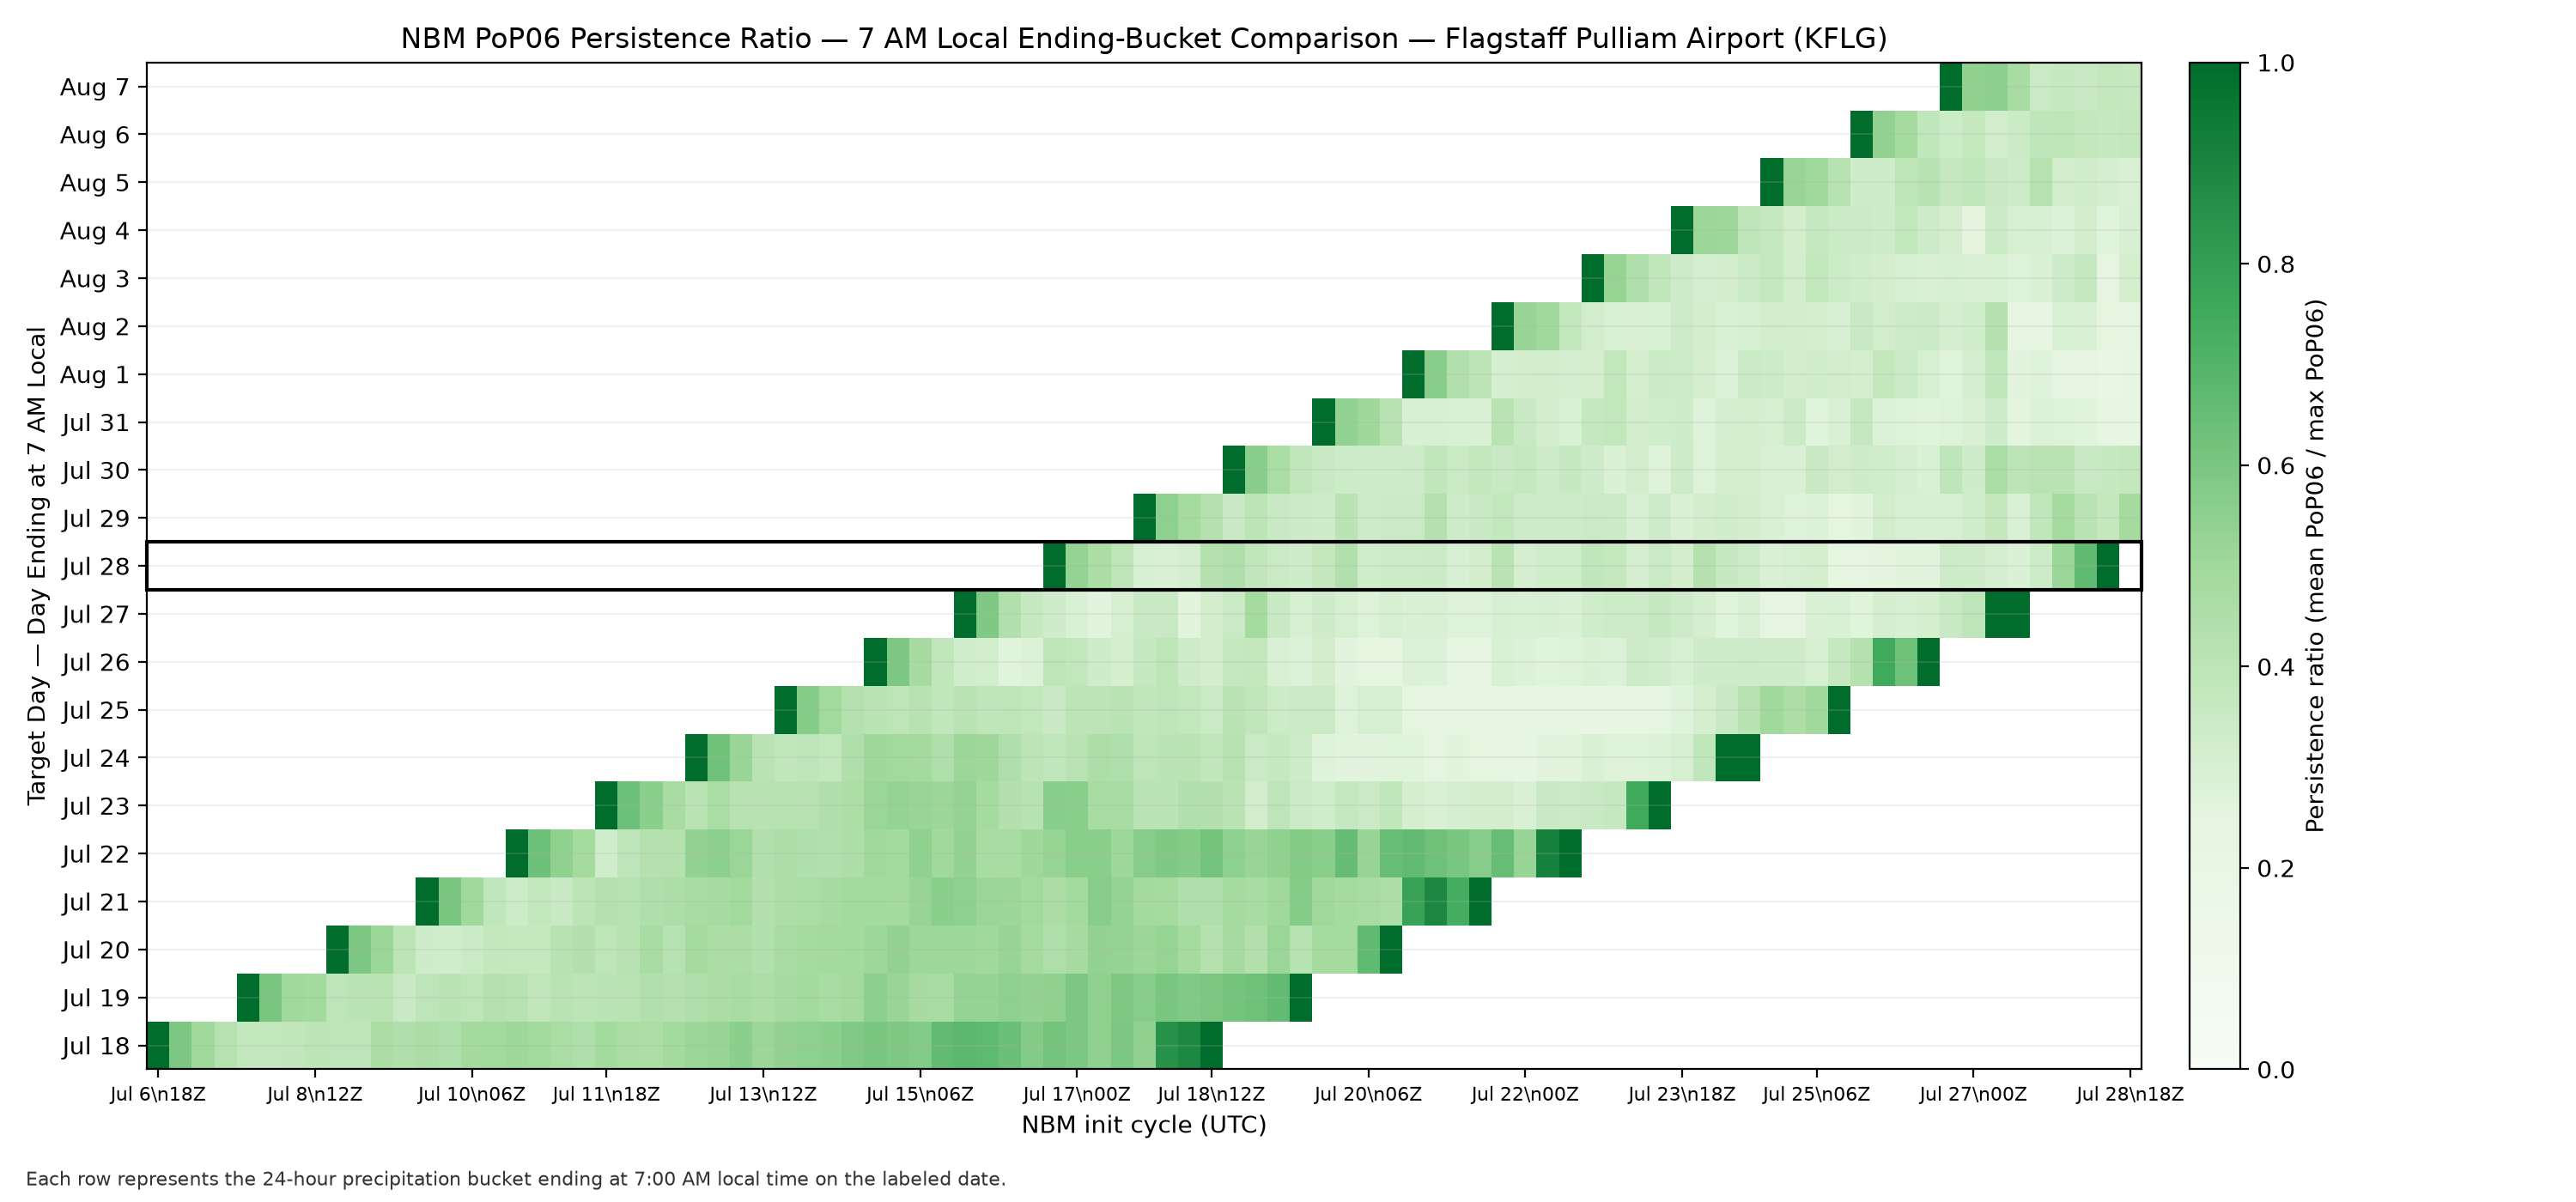
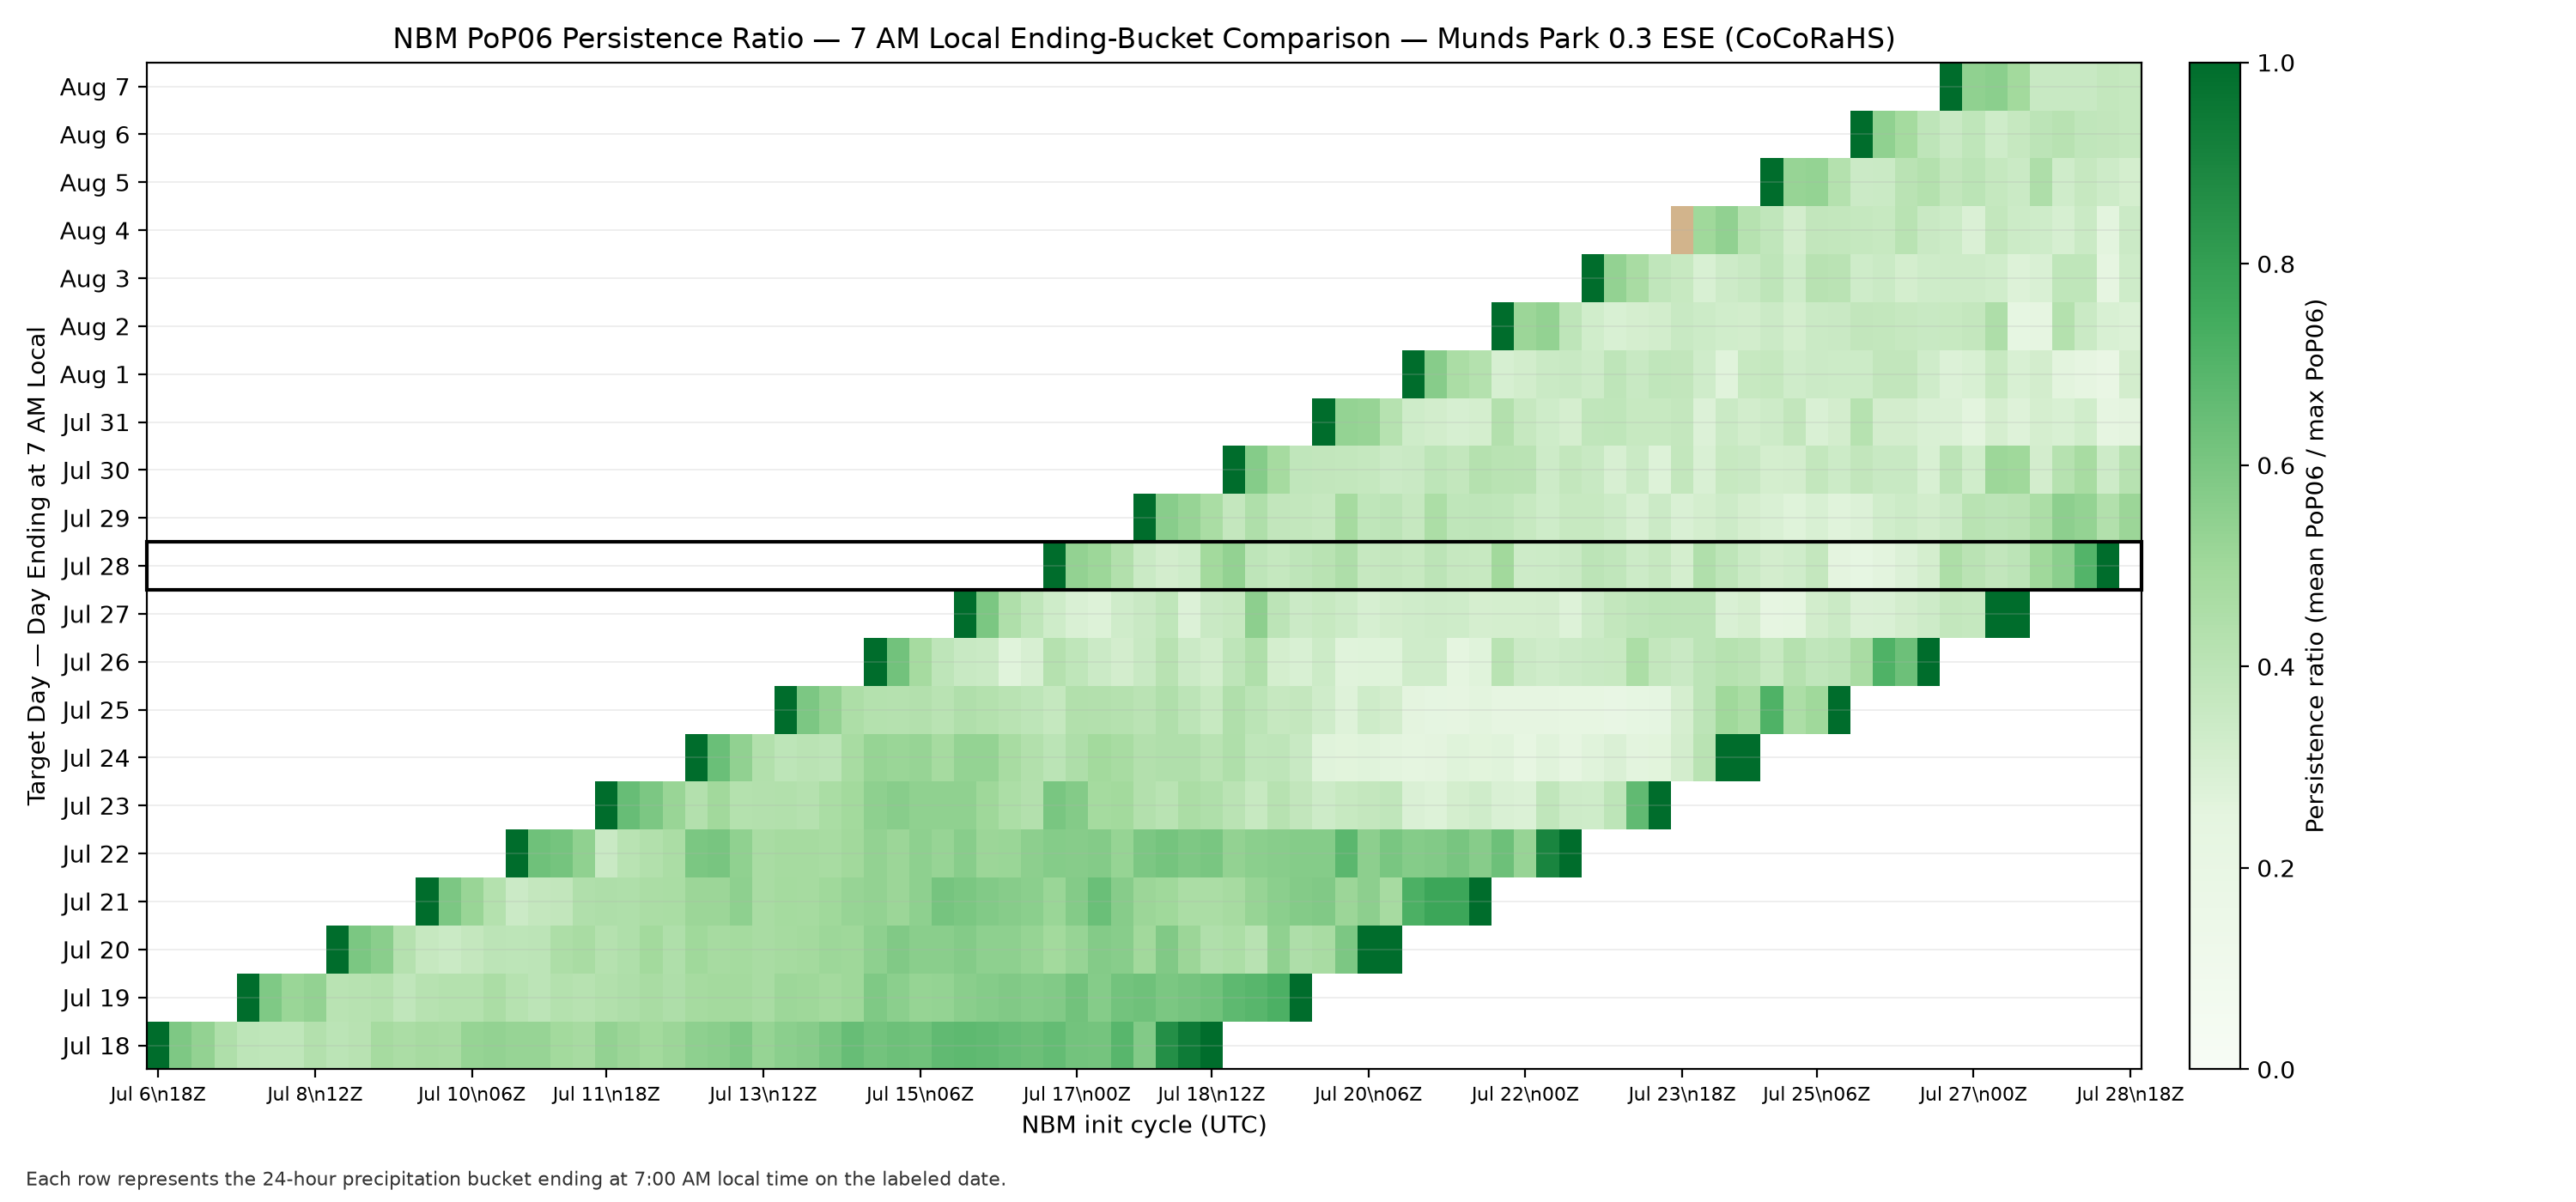
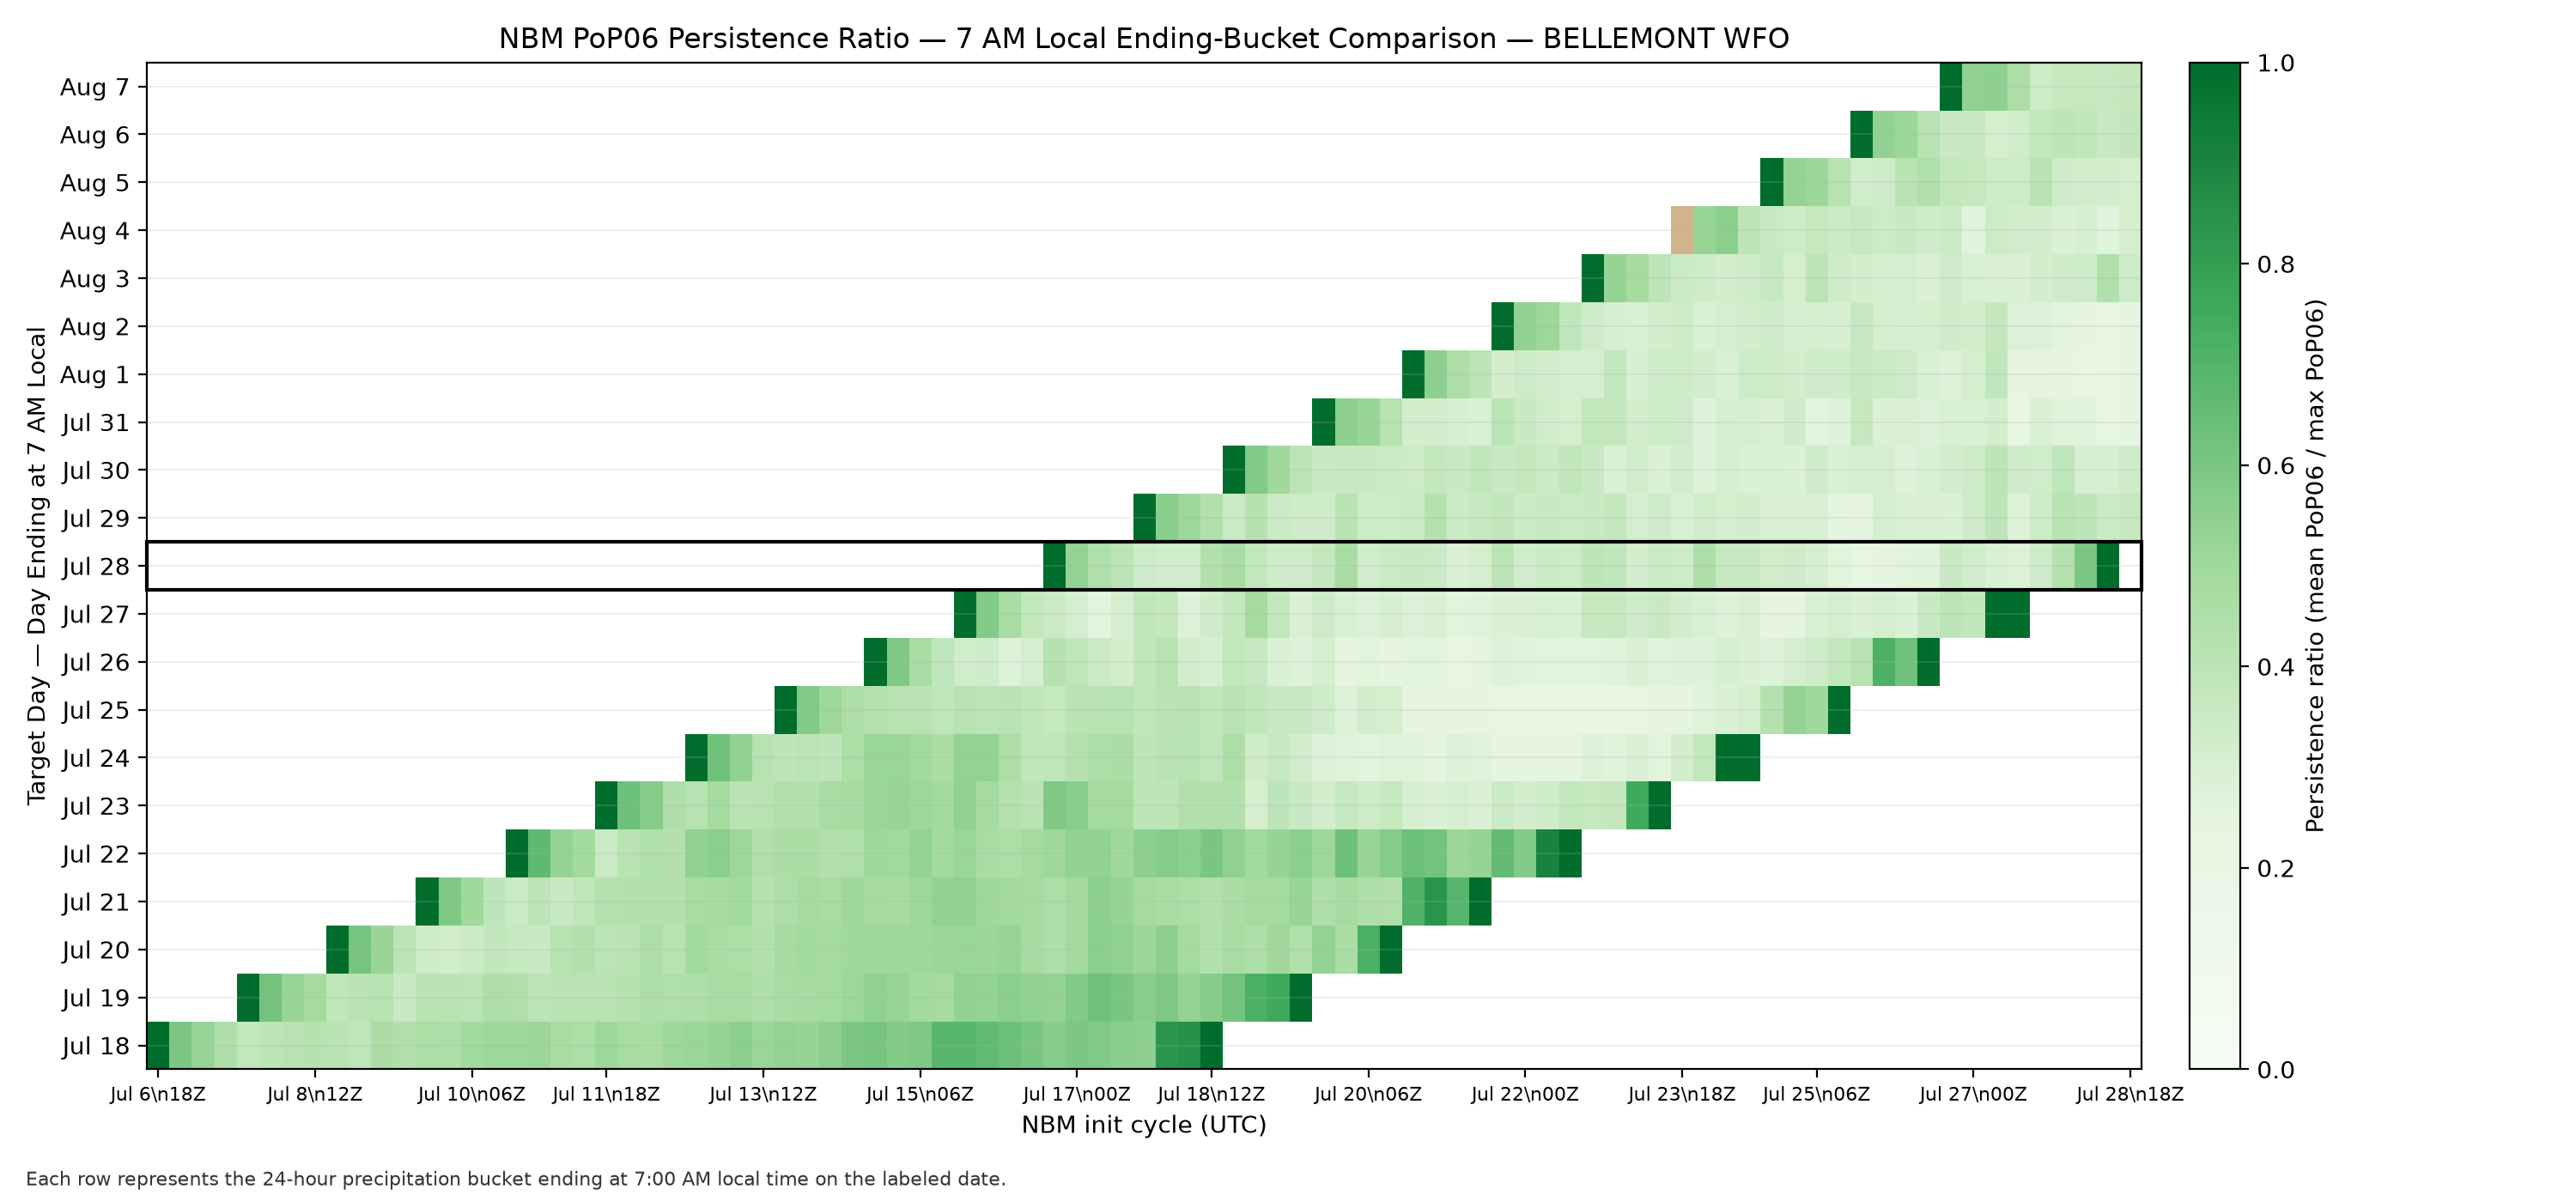
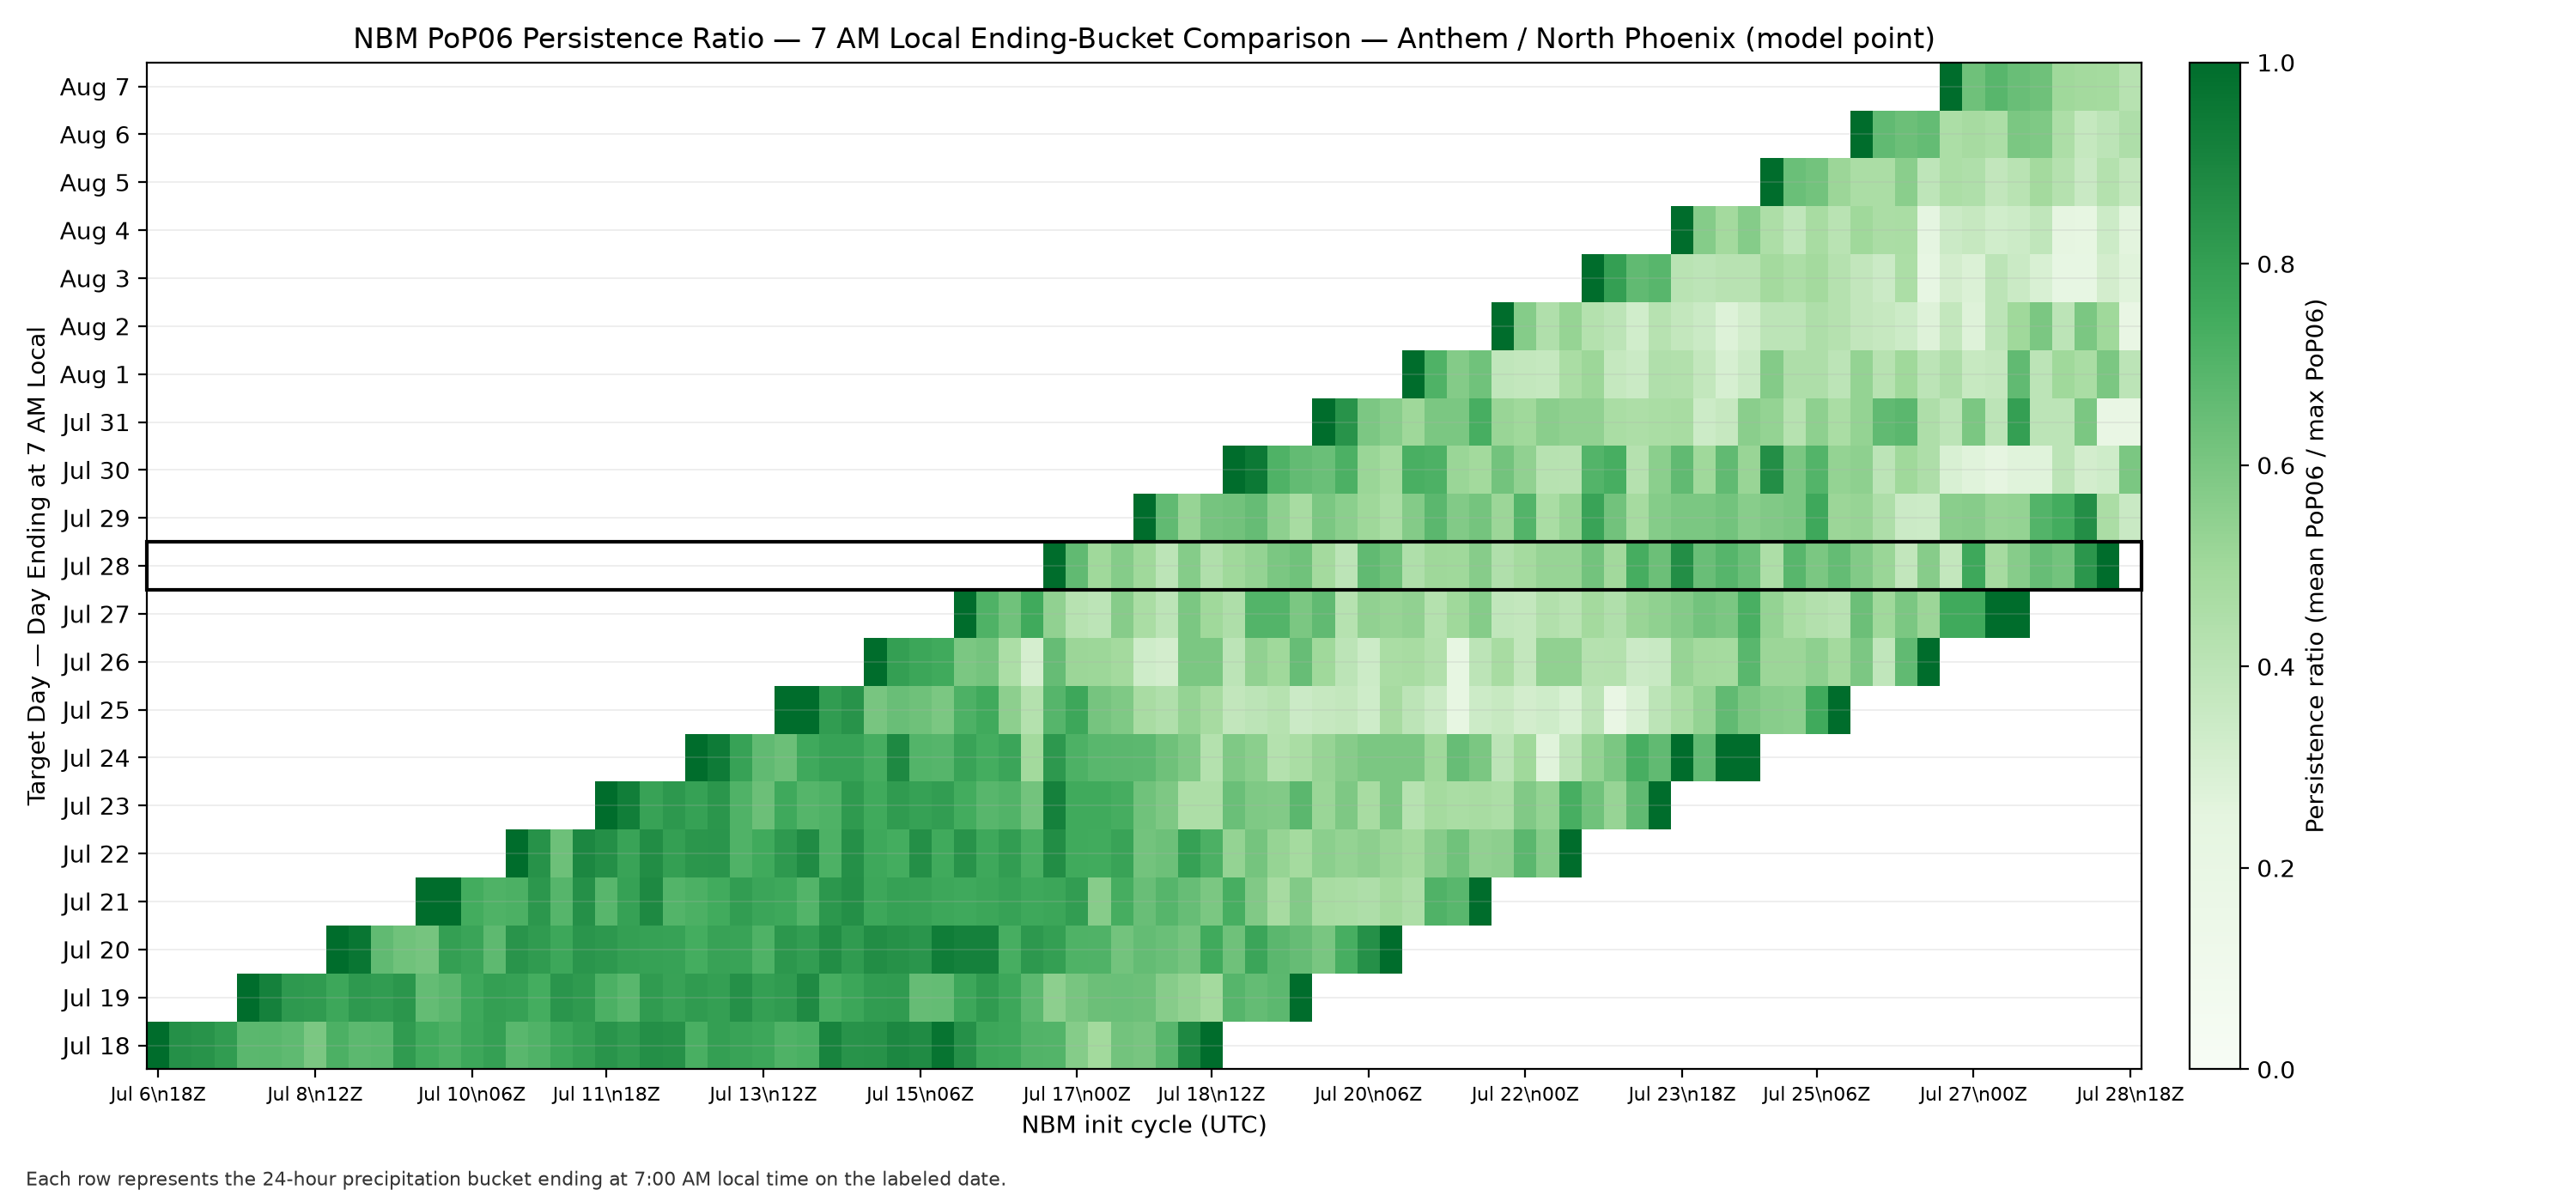
NBM PoP06 heatmaps
“PoP06” is Probability of Precipitation over a 6-hour window — NOAA’s
National Blend of Models’ percentage likelihood that measurable rain falls in that
window. These heatmaps roll several 6-hour windows into one daily value (using a 7 AM local
cutoff, matching a full local day) in three ways: Daily Mean averages the
probability across the day’s windows; Daily Max shows the single
highest window probability that day; and Persistence Ratio (mean ÷
max) shows how consistent that probability was across the day — close to 1 means the
chance of rain stayed fairly steady all day, while a low ratio means only part of the day
carried real risk while the rest looked dry.
Browse by Model & Data Type