HRRR
8 of 8 sites reporting • up to 14 forecast cycle(s) accumulated so far
HRRR • RRFS • REFS • Page generated: July 28, 2026, 6:02 PM MST (July 29, 2026, 1:02 AM UTC)
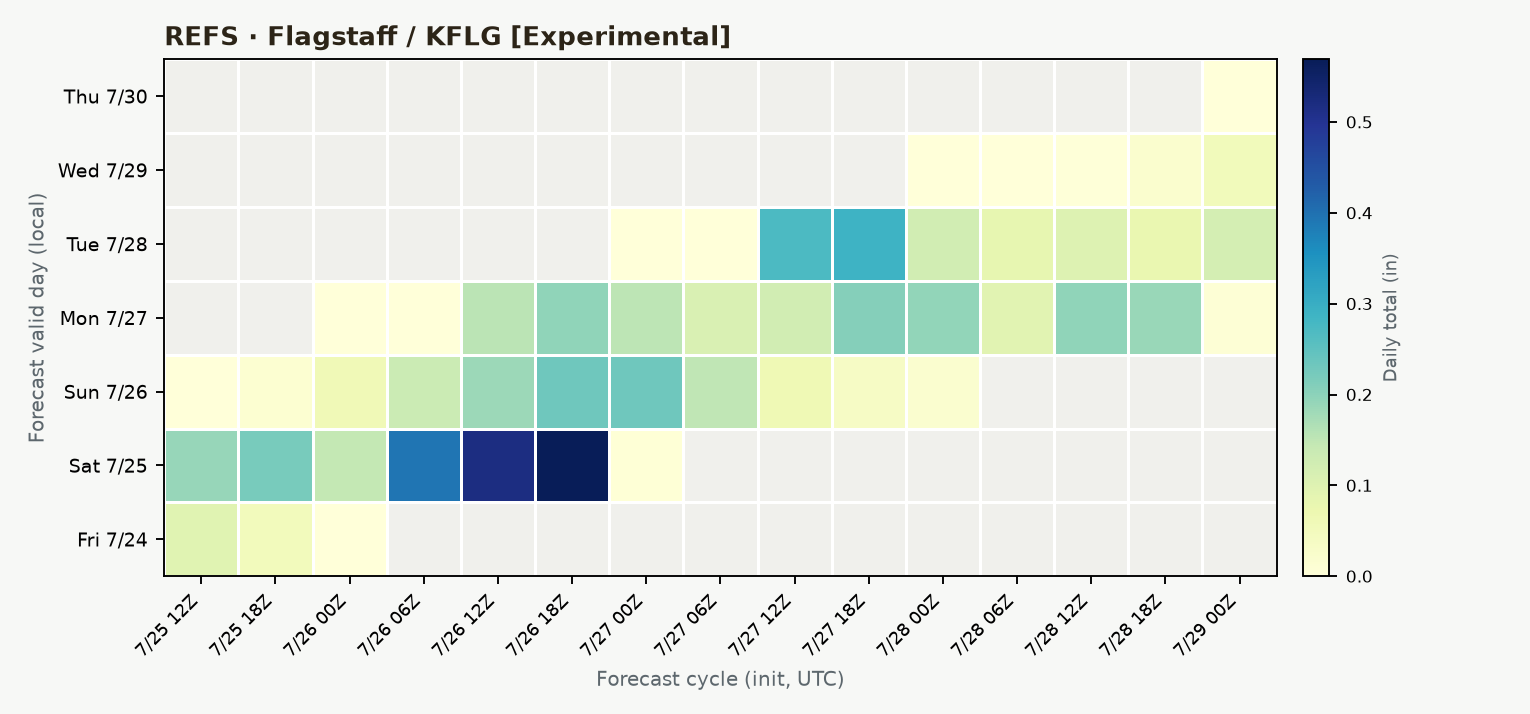
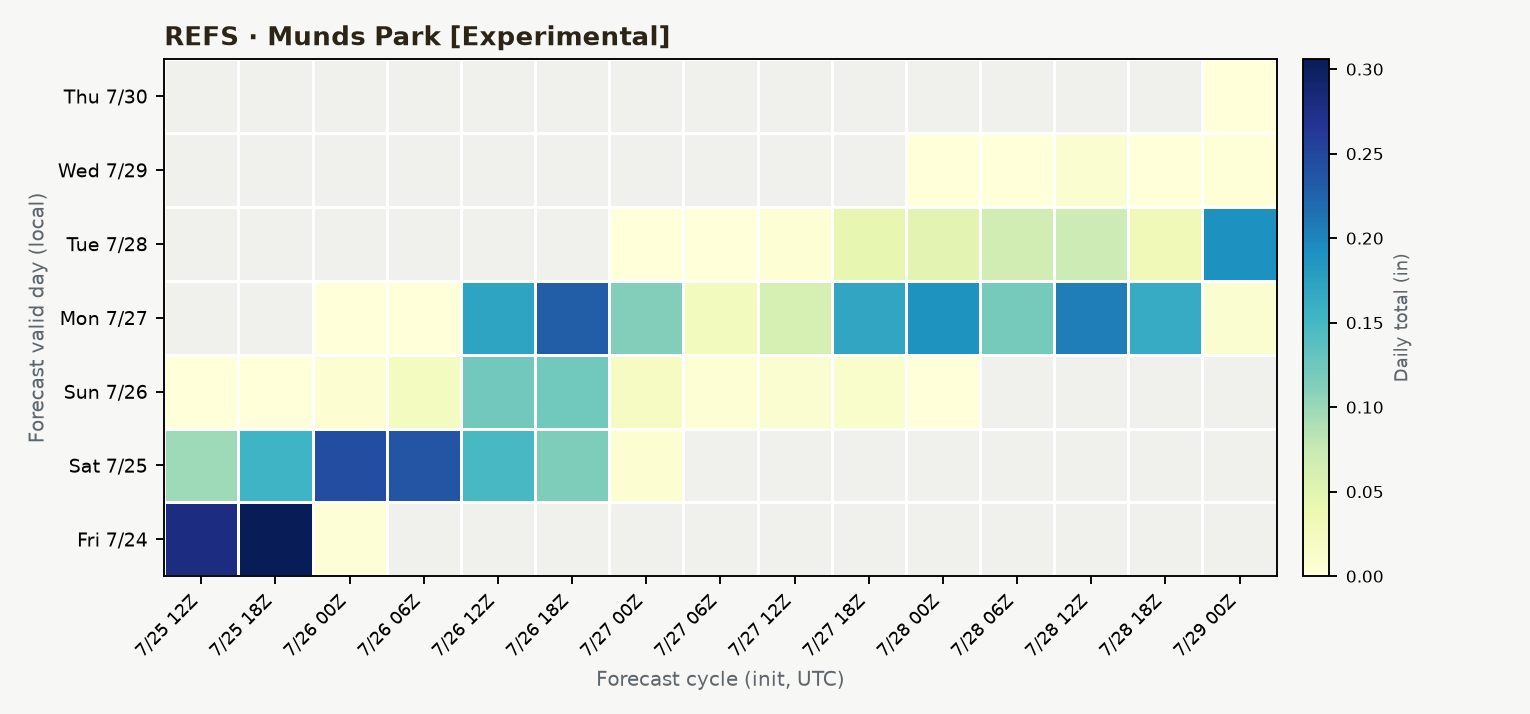
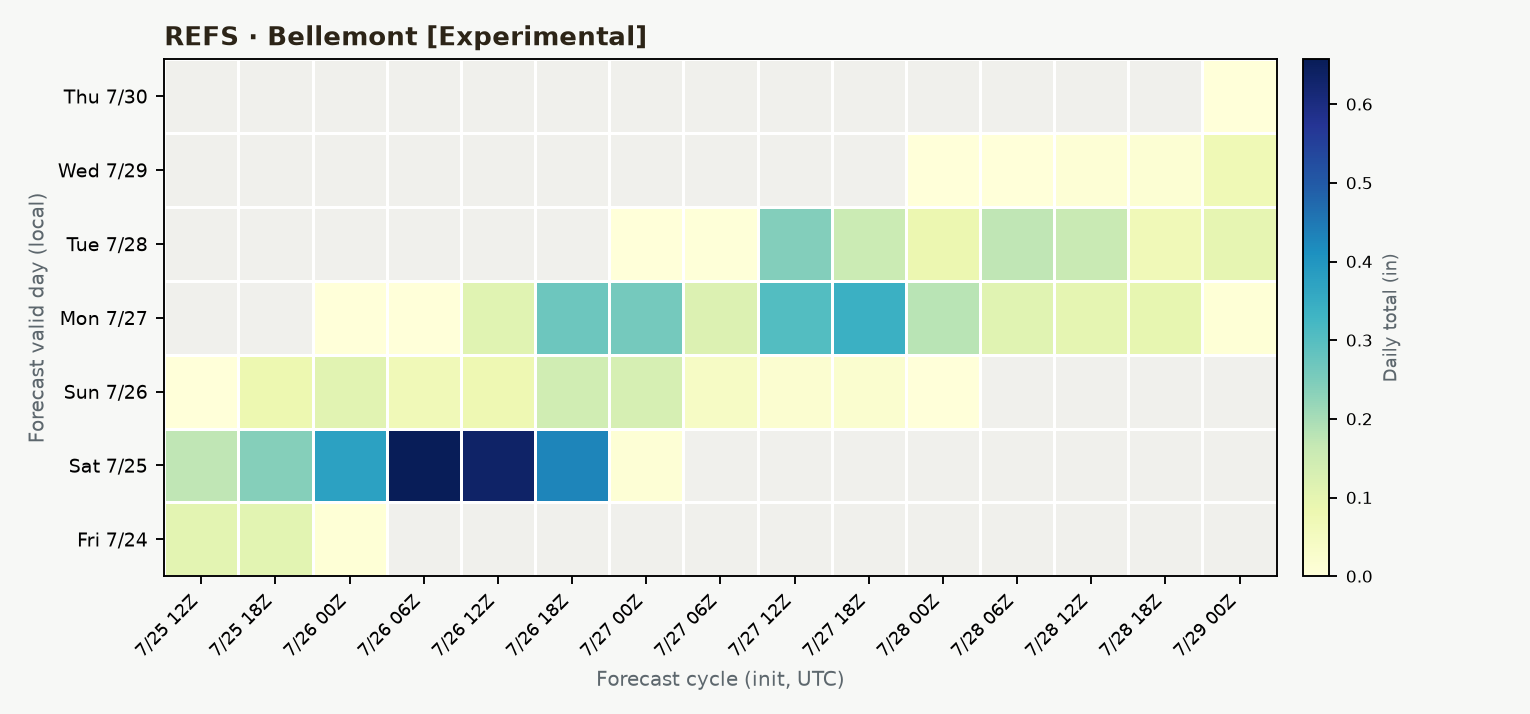
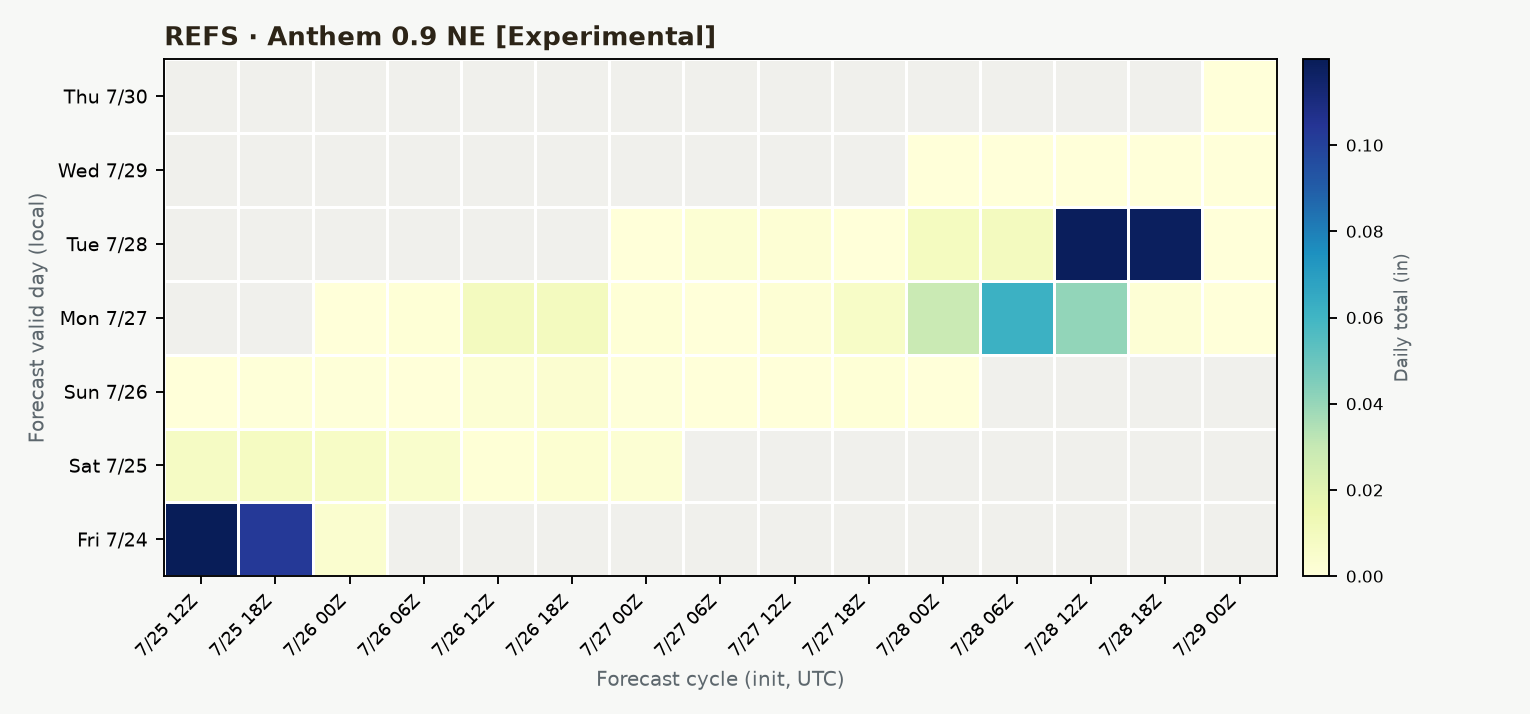
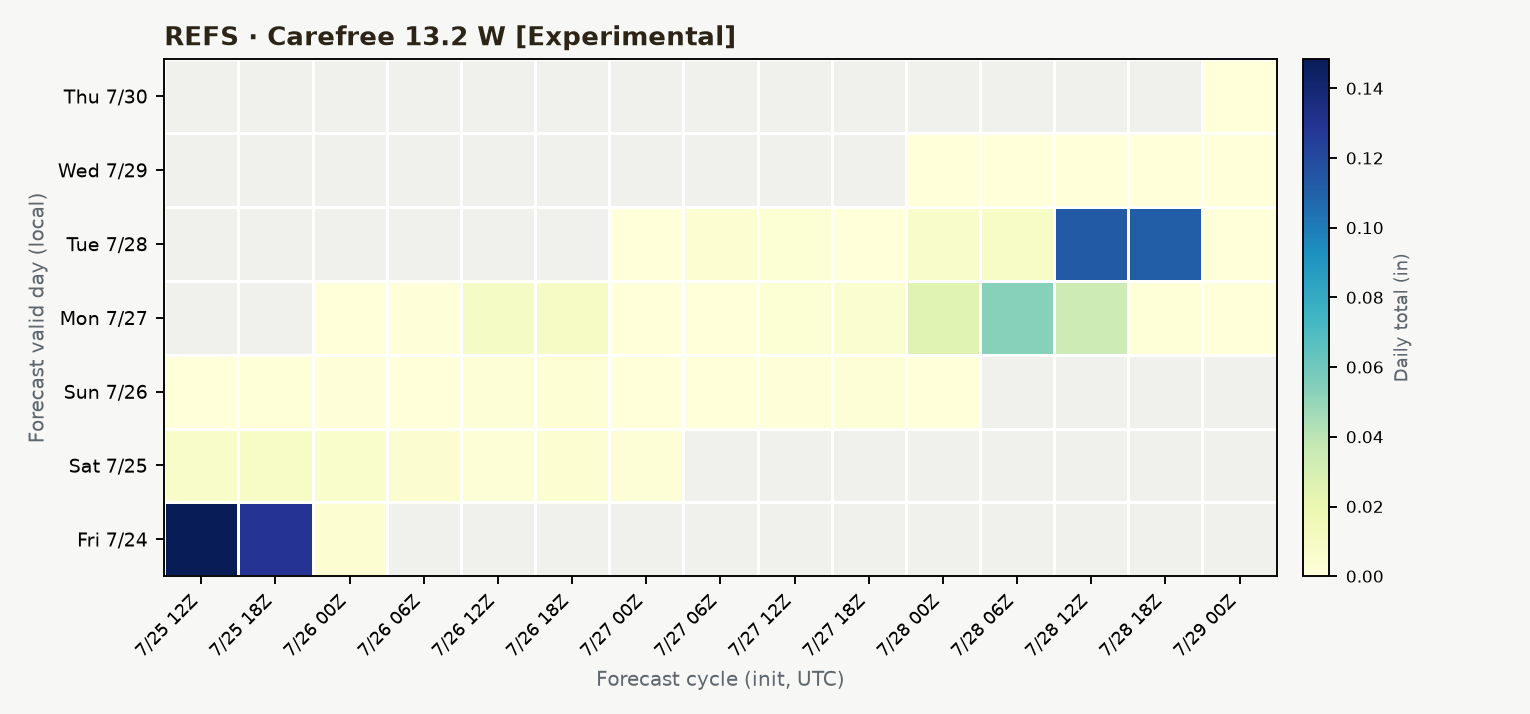
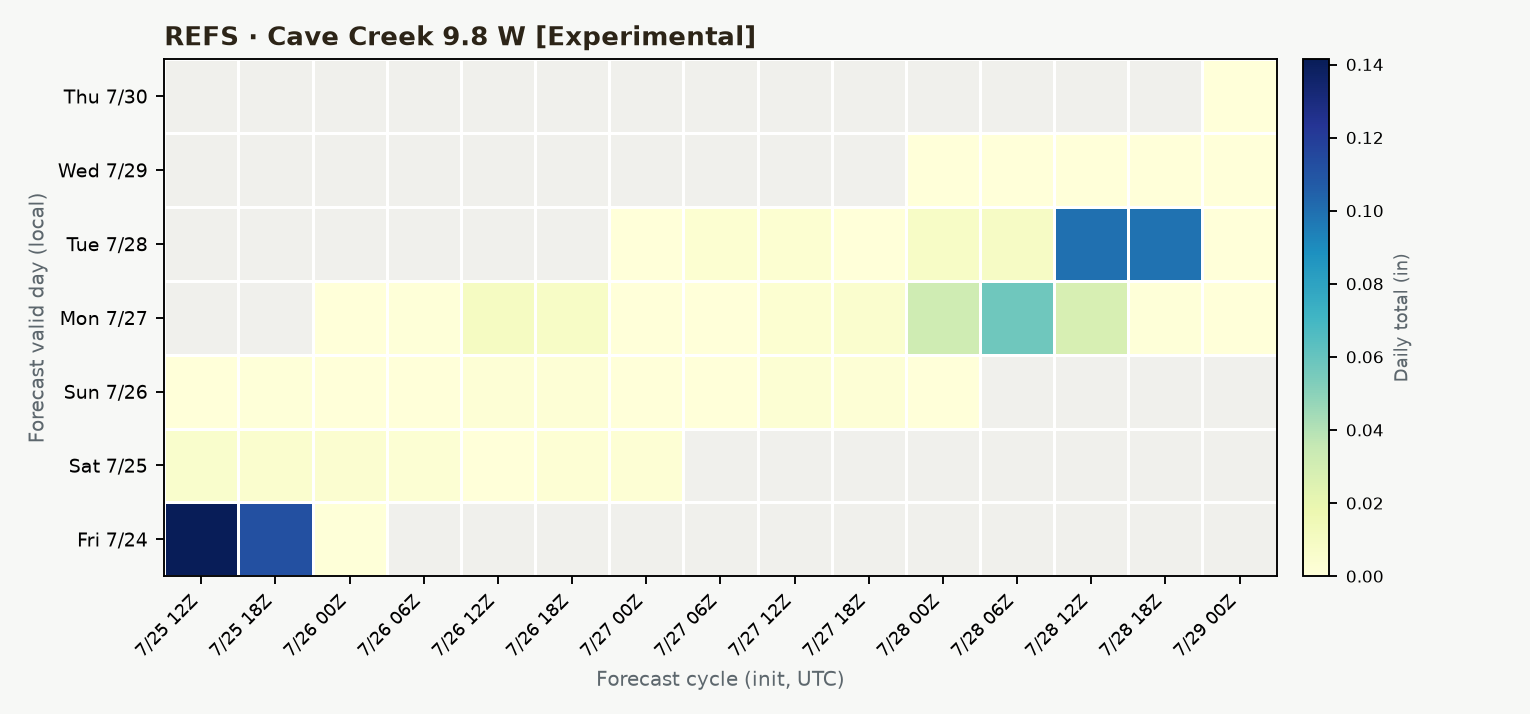
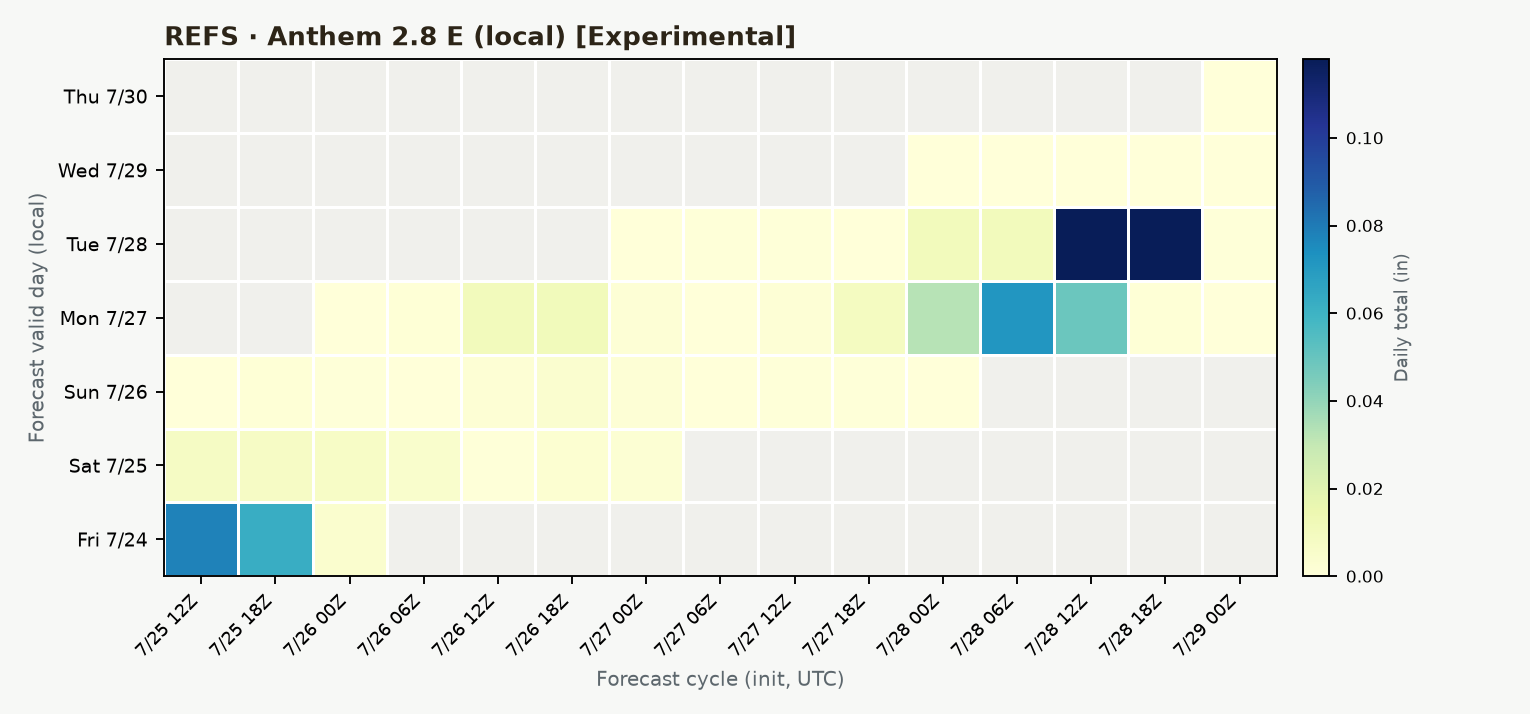
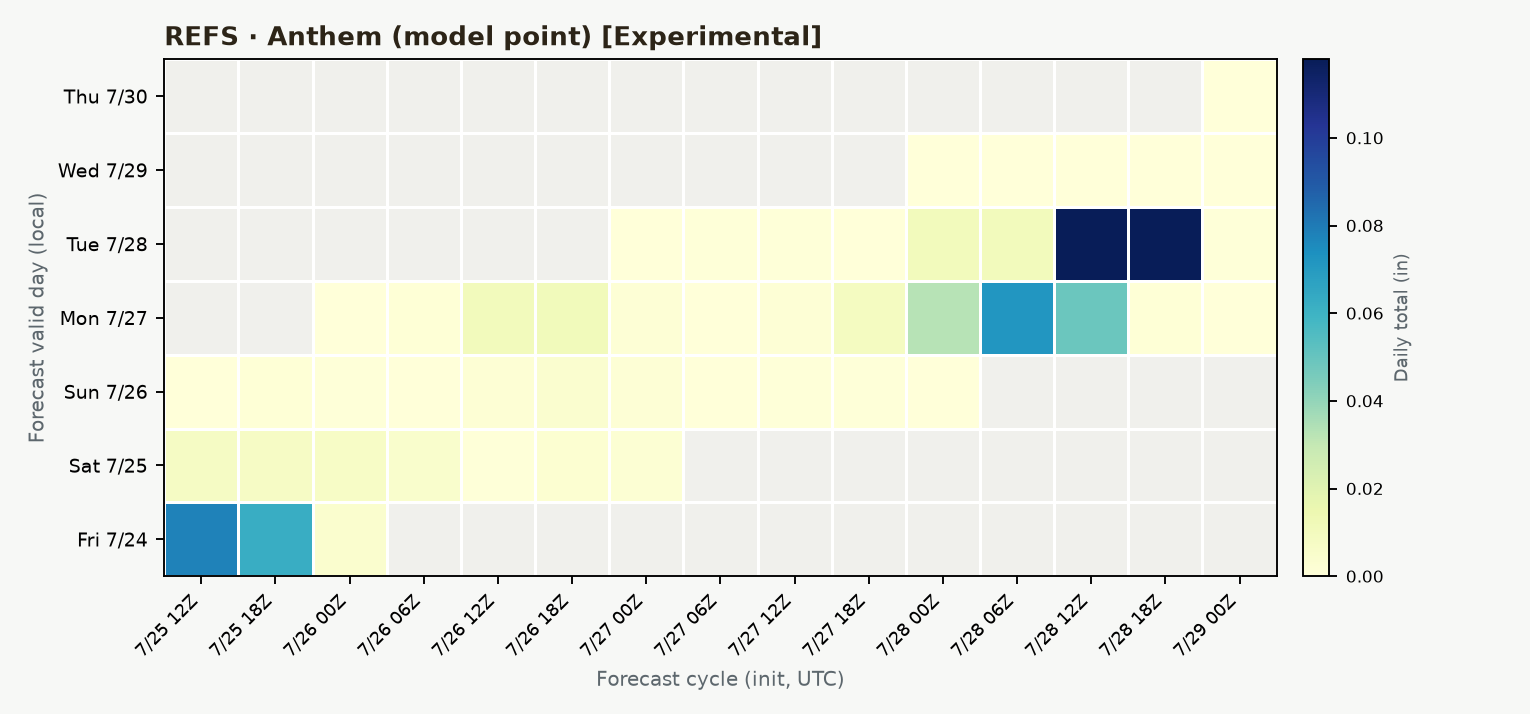
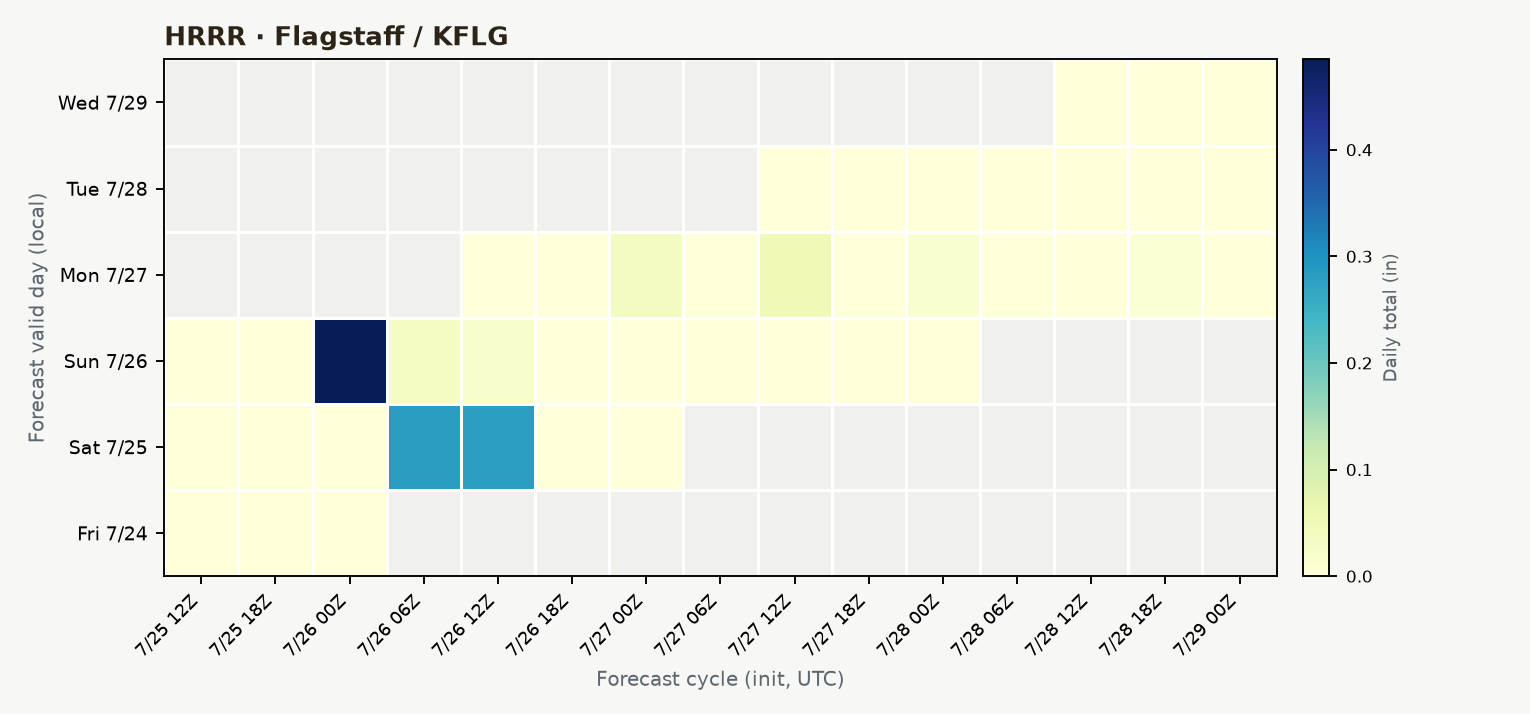
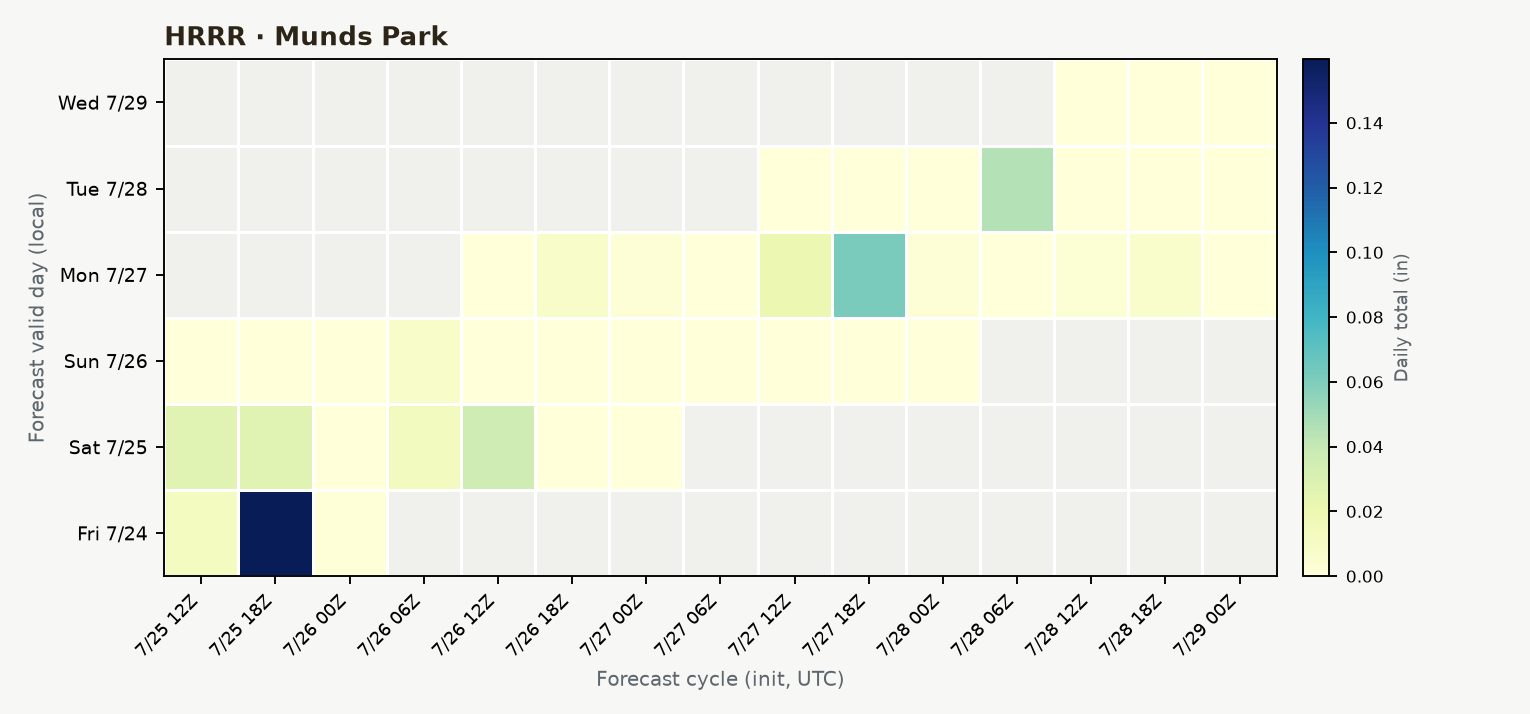
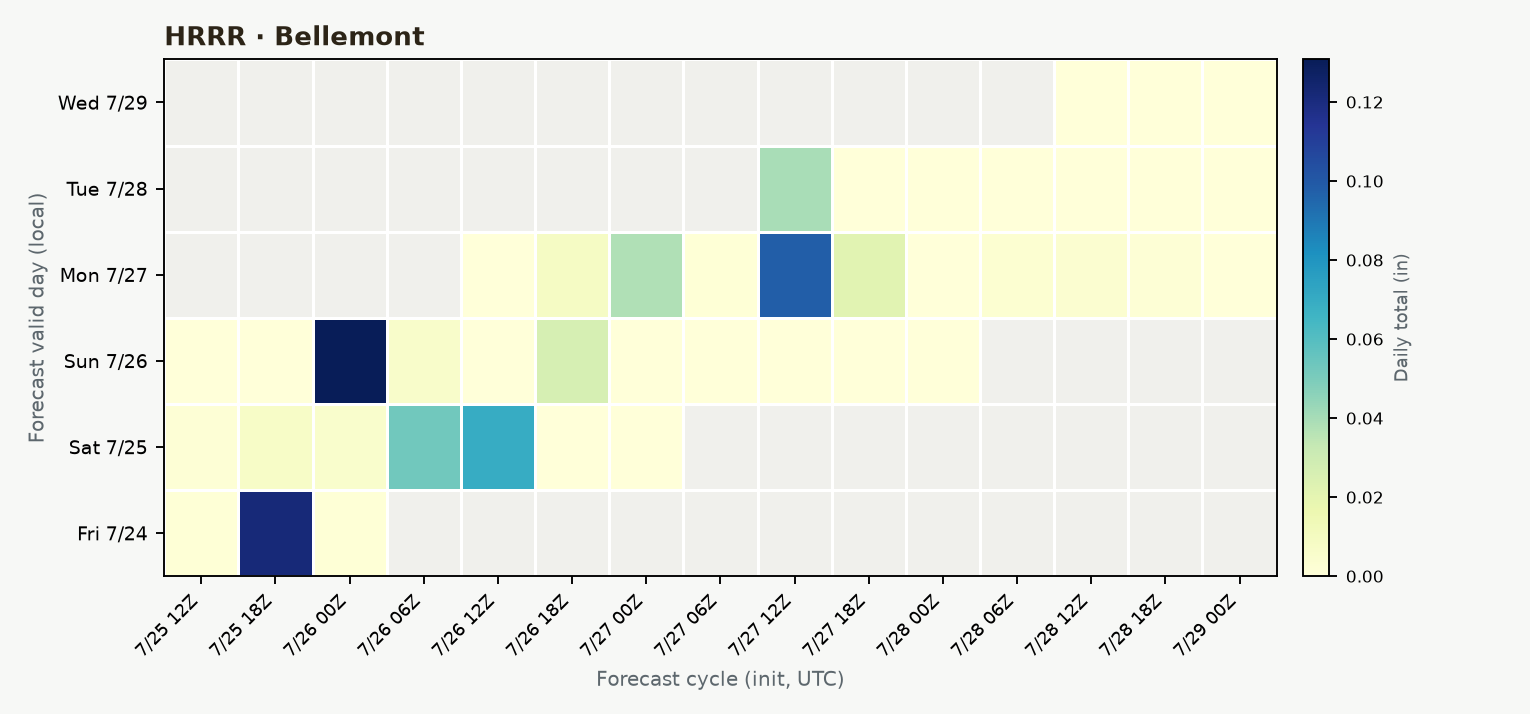
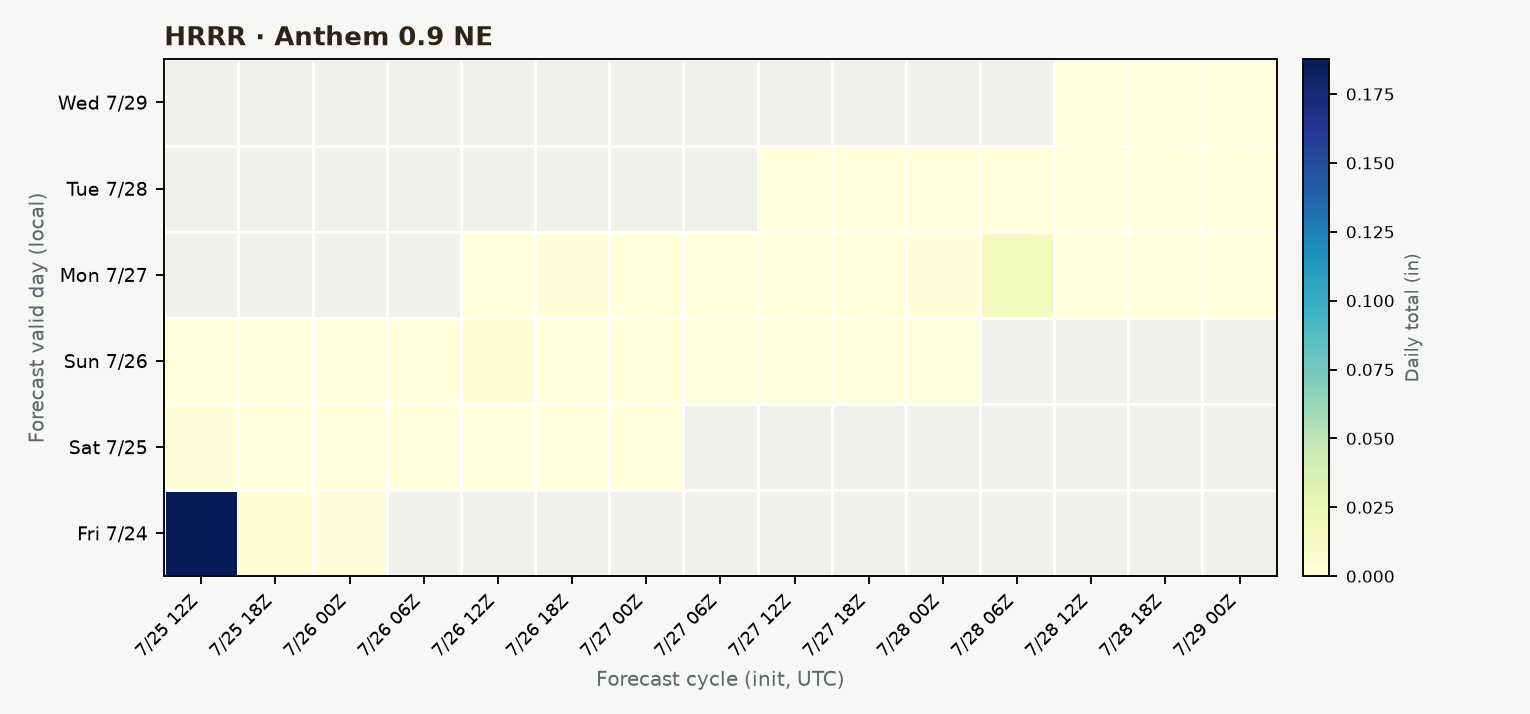
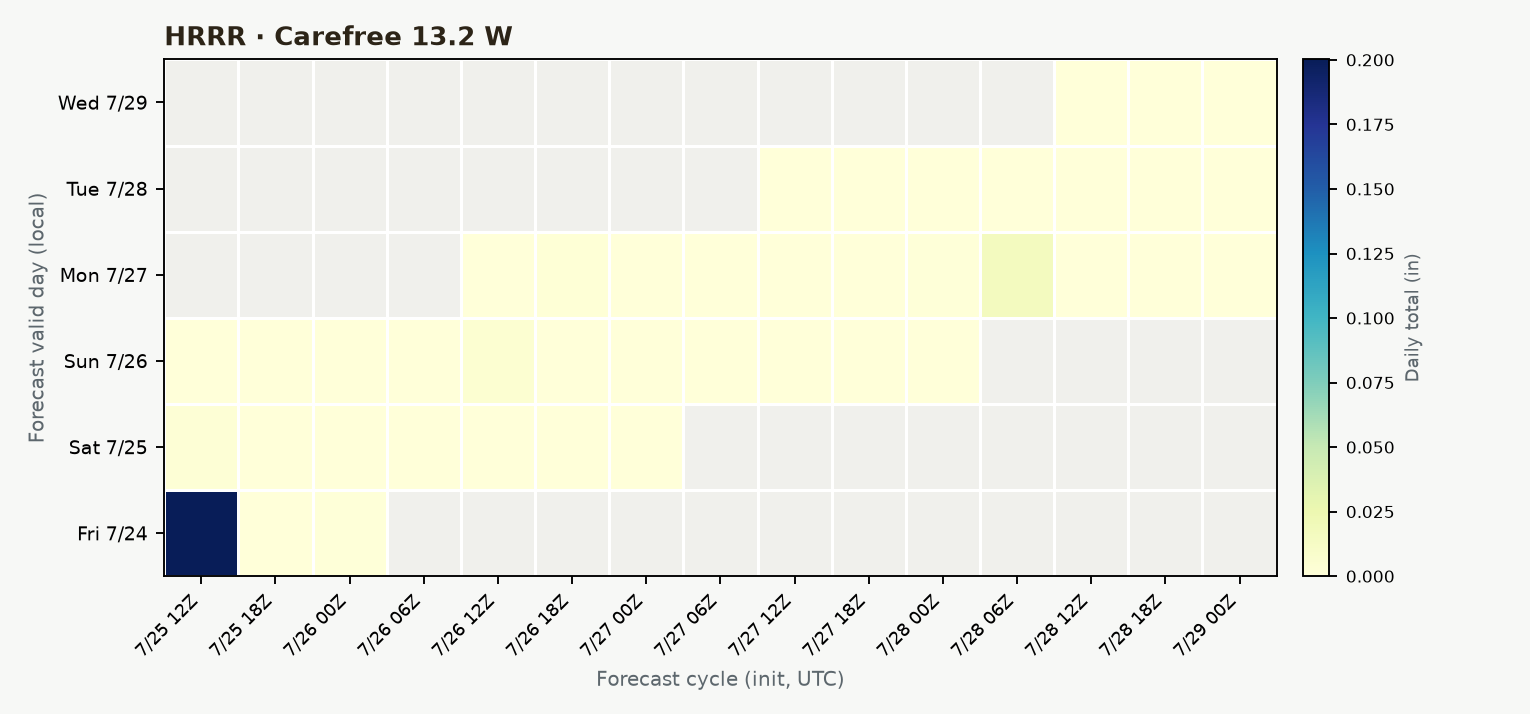
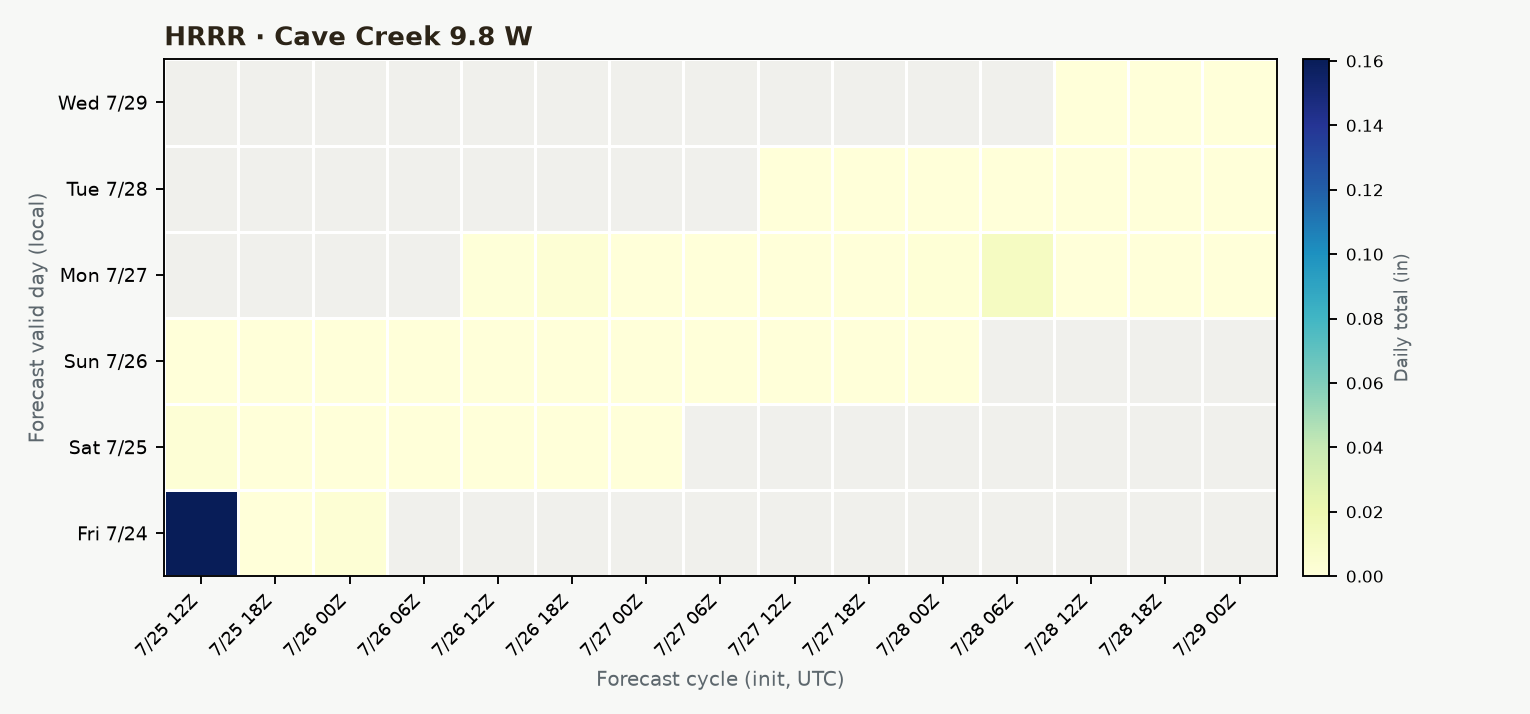
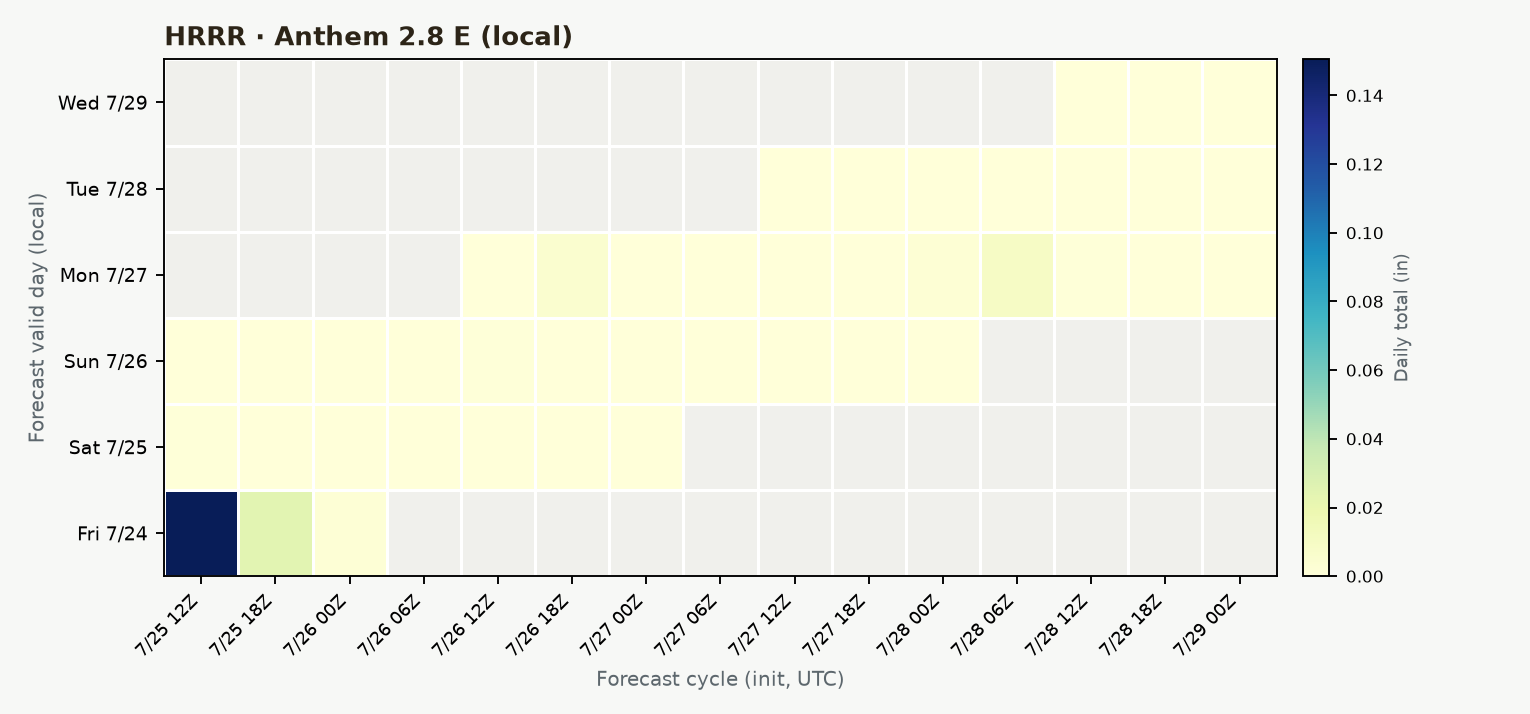
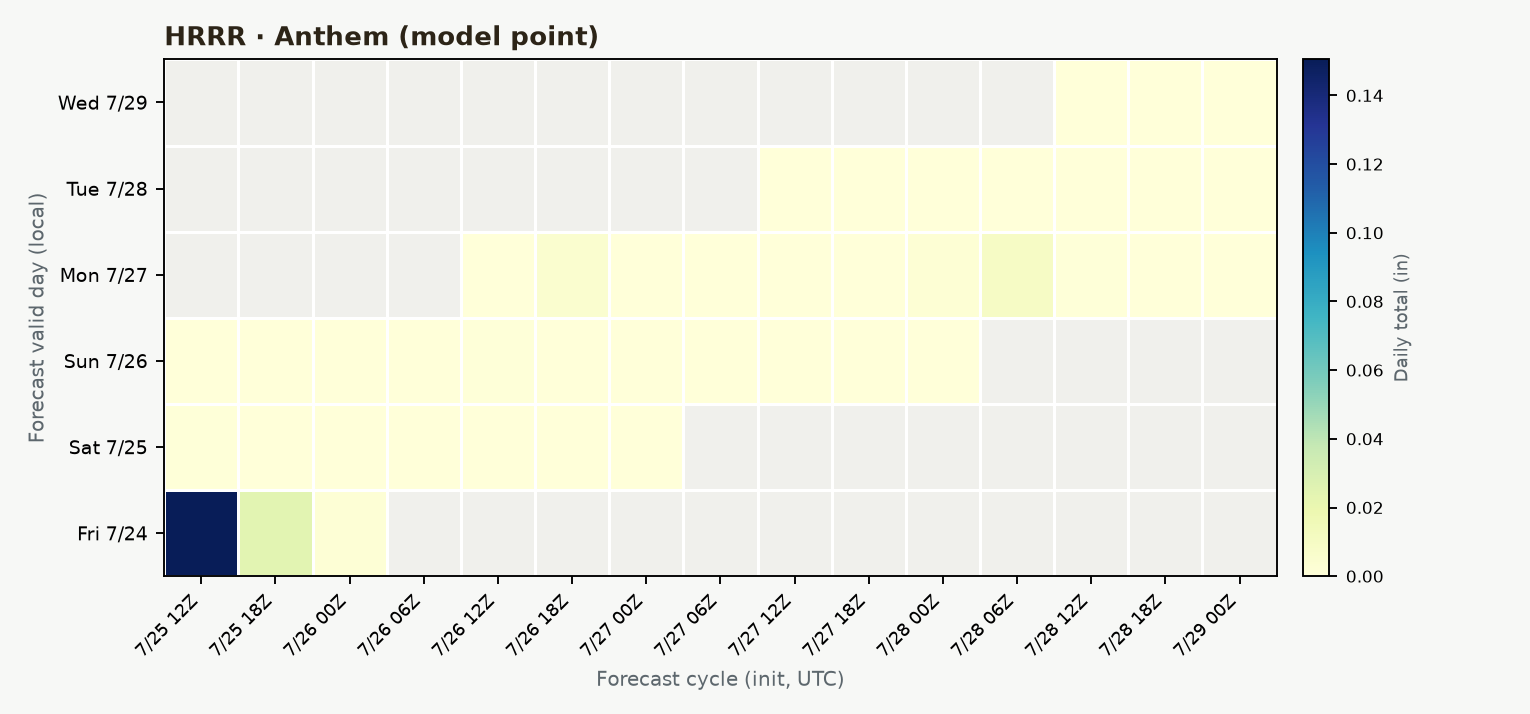
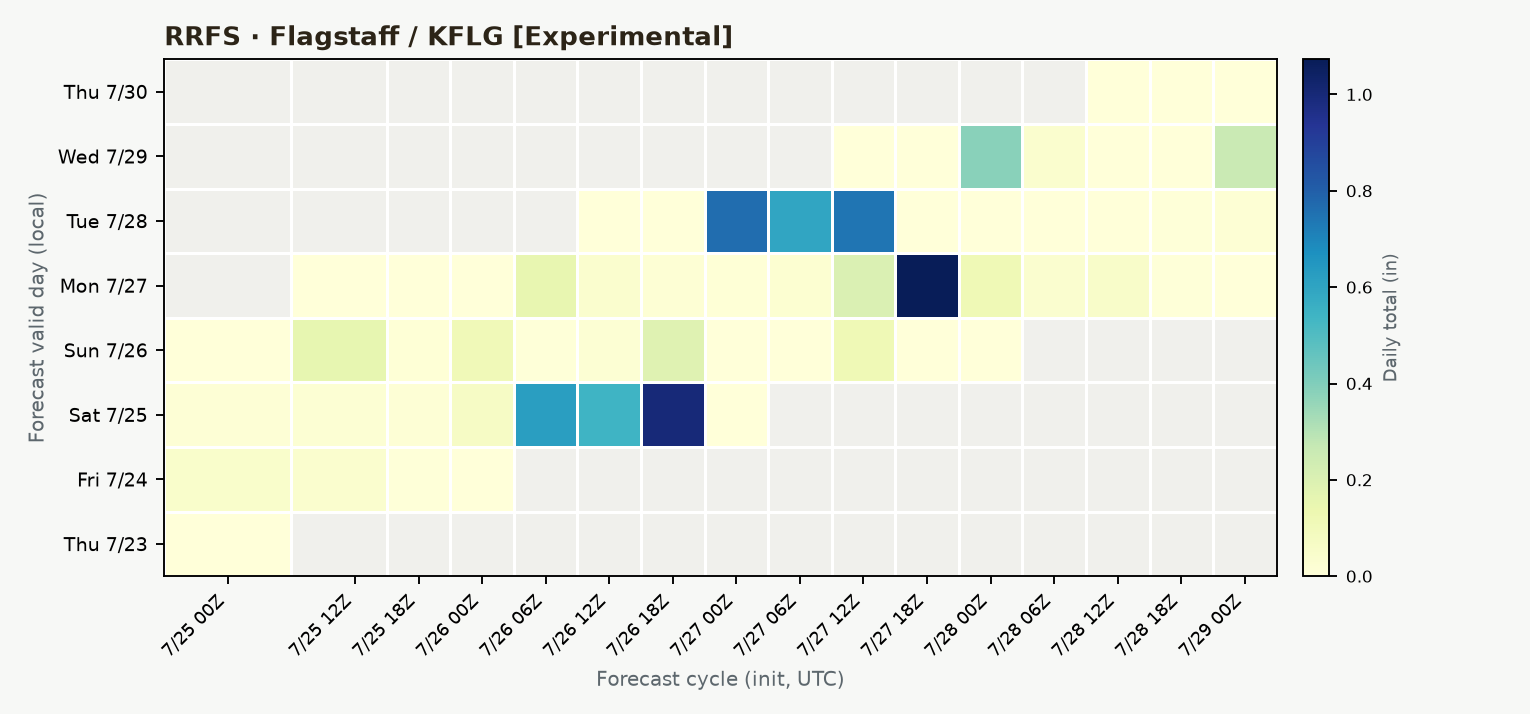
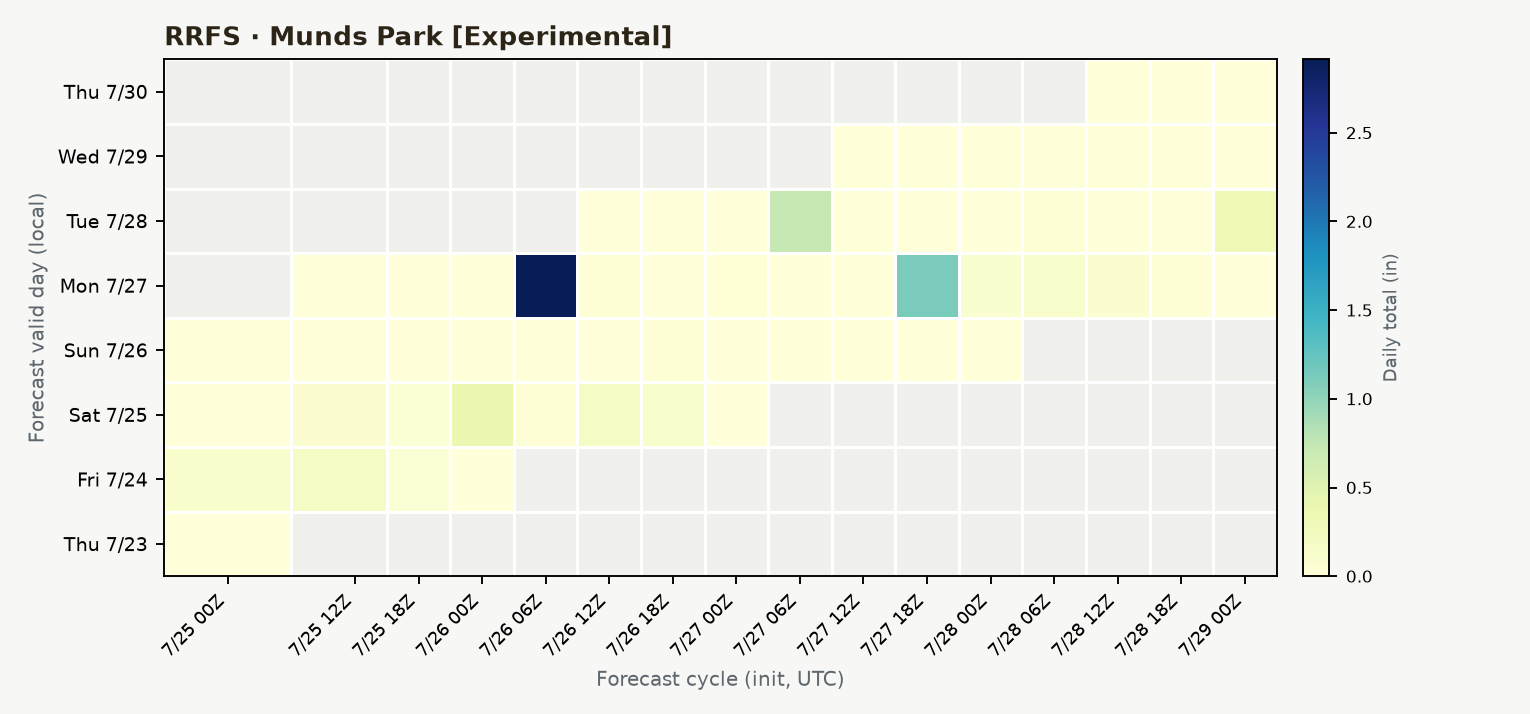
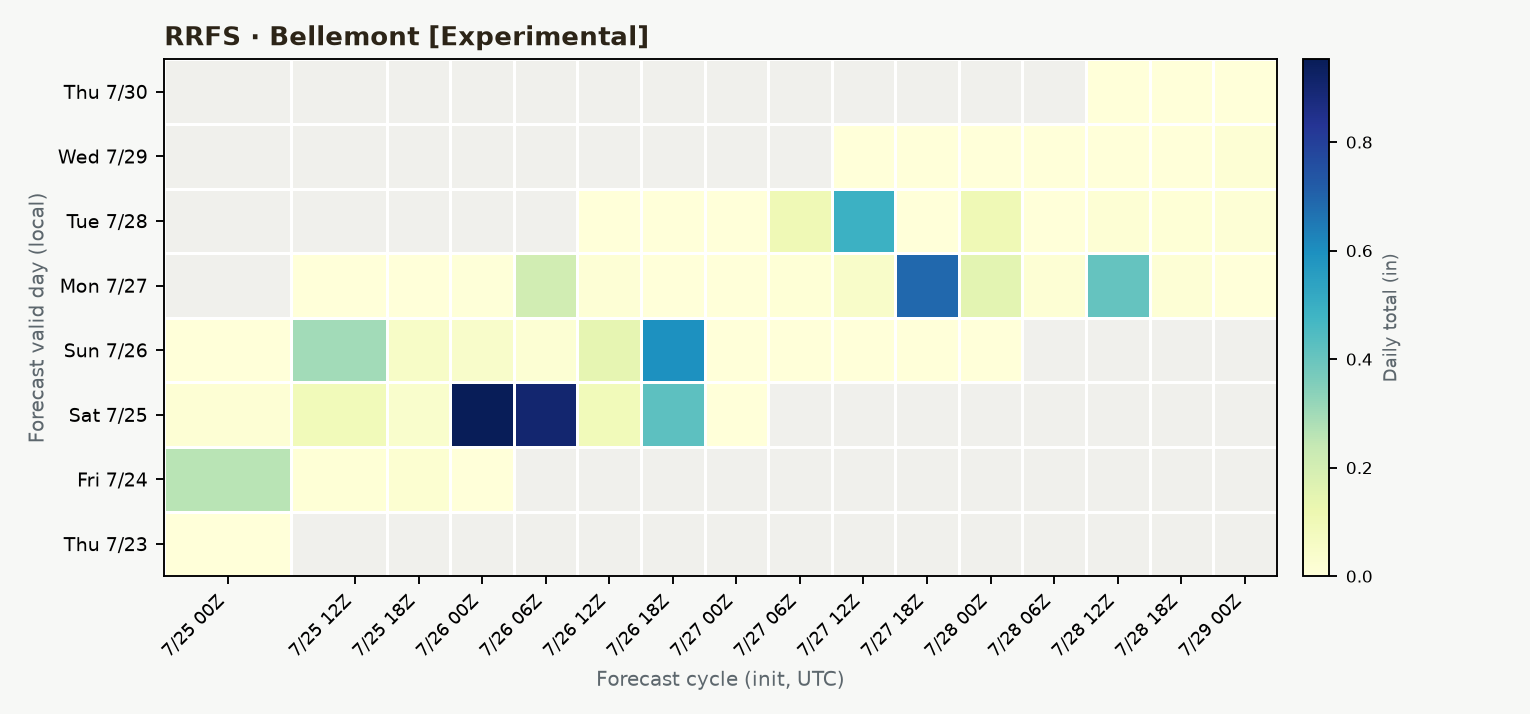
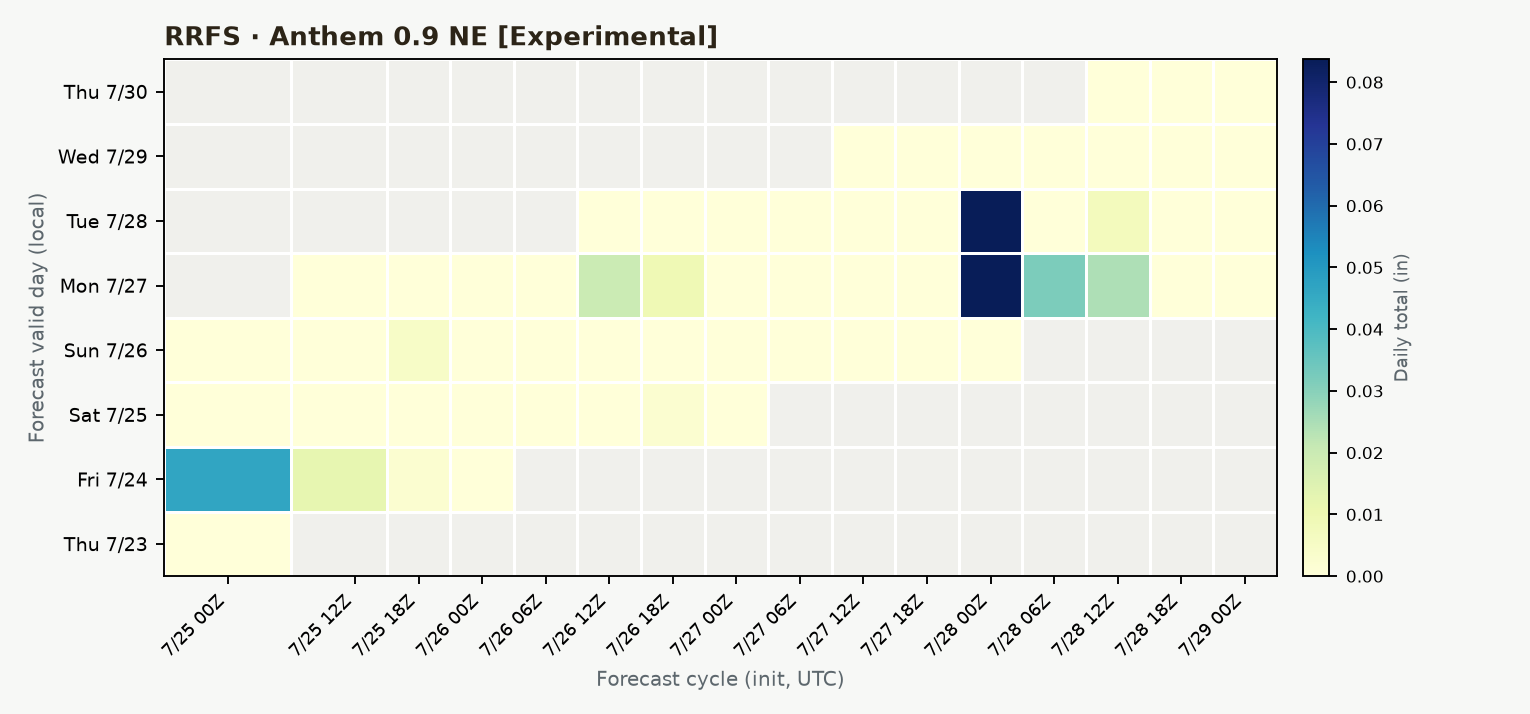
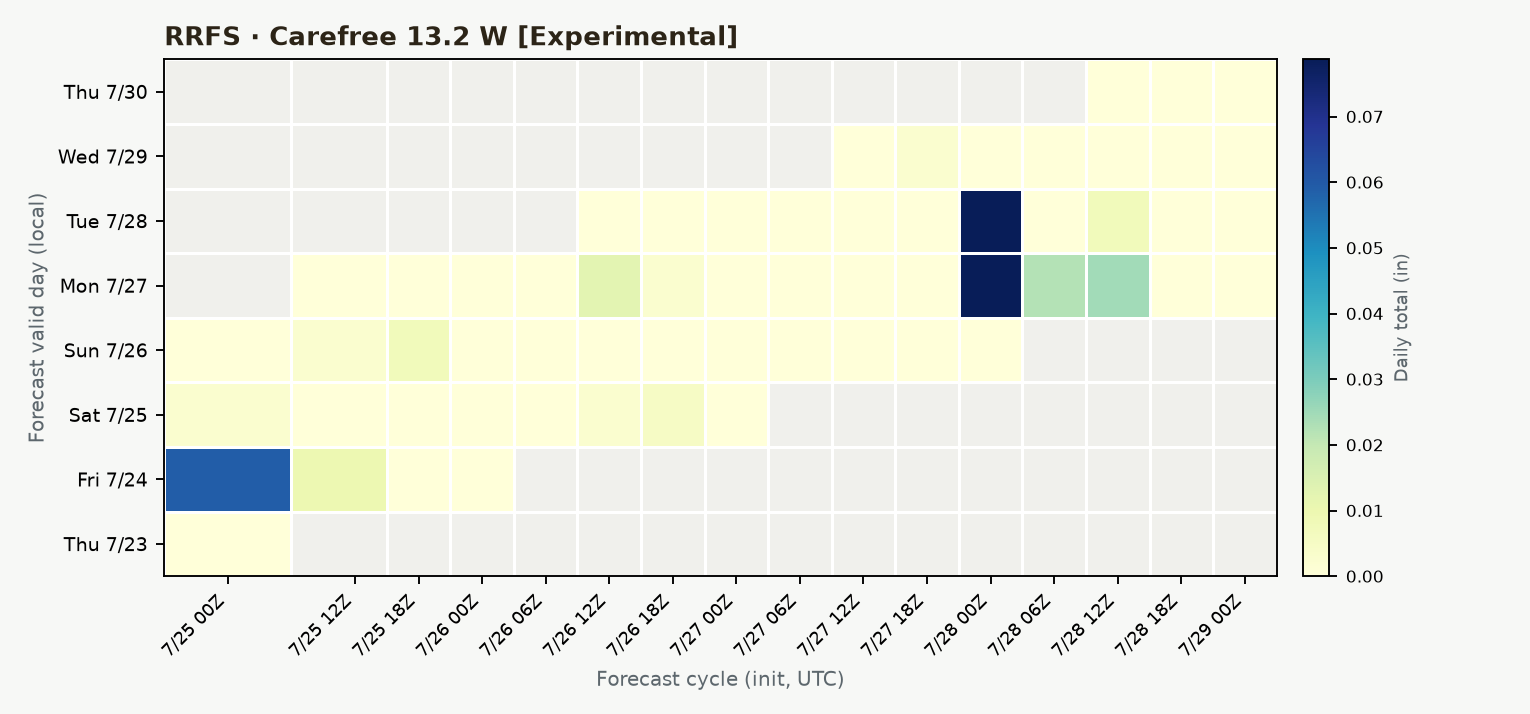
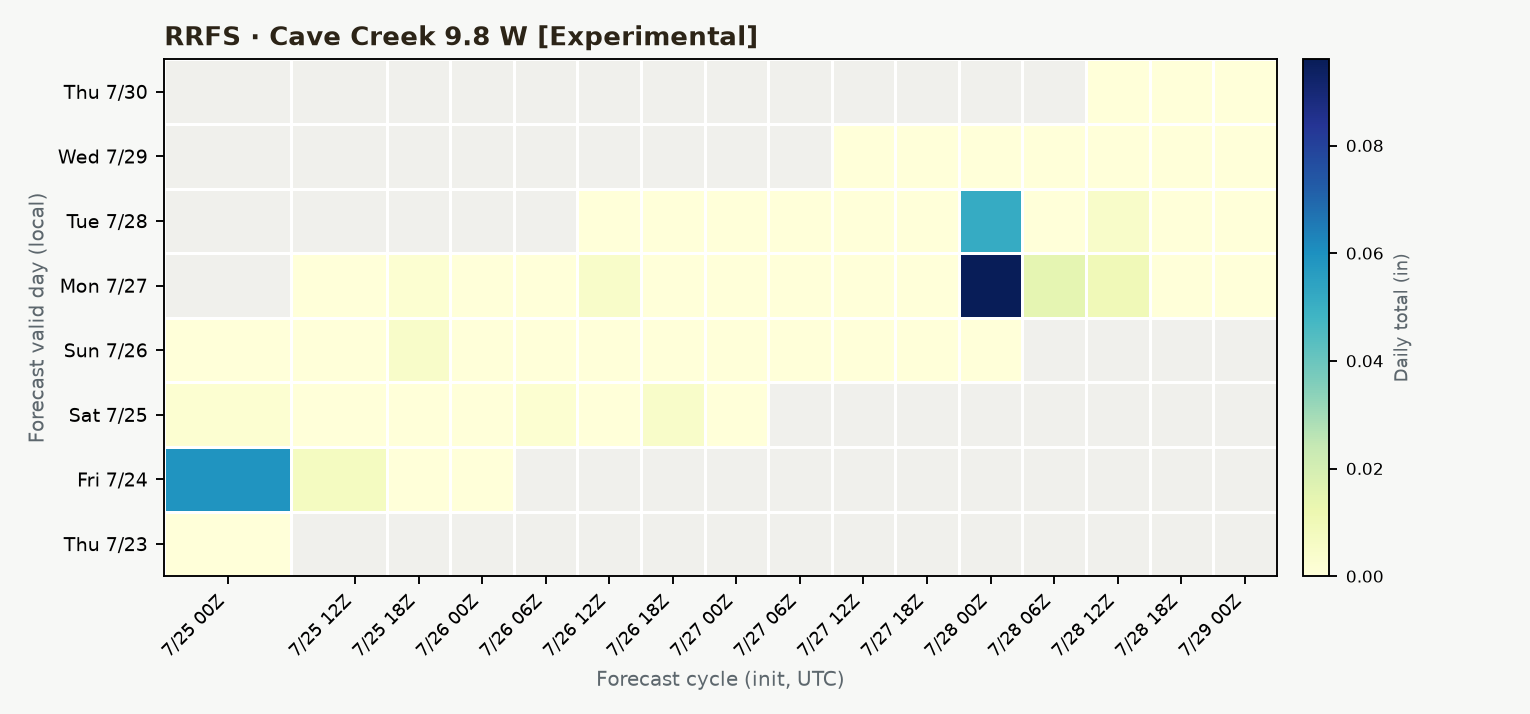
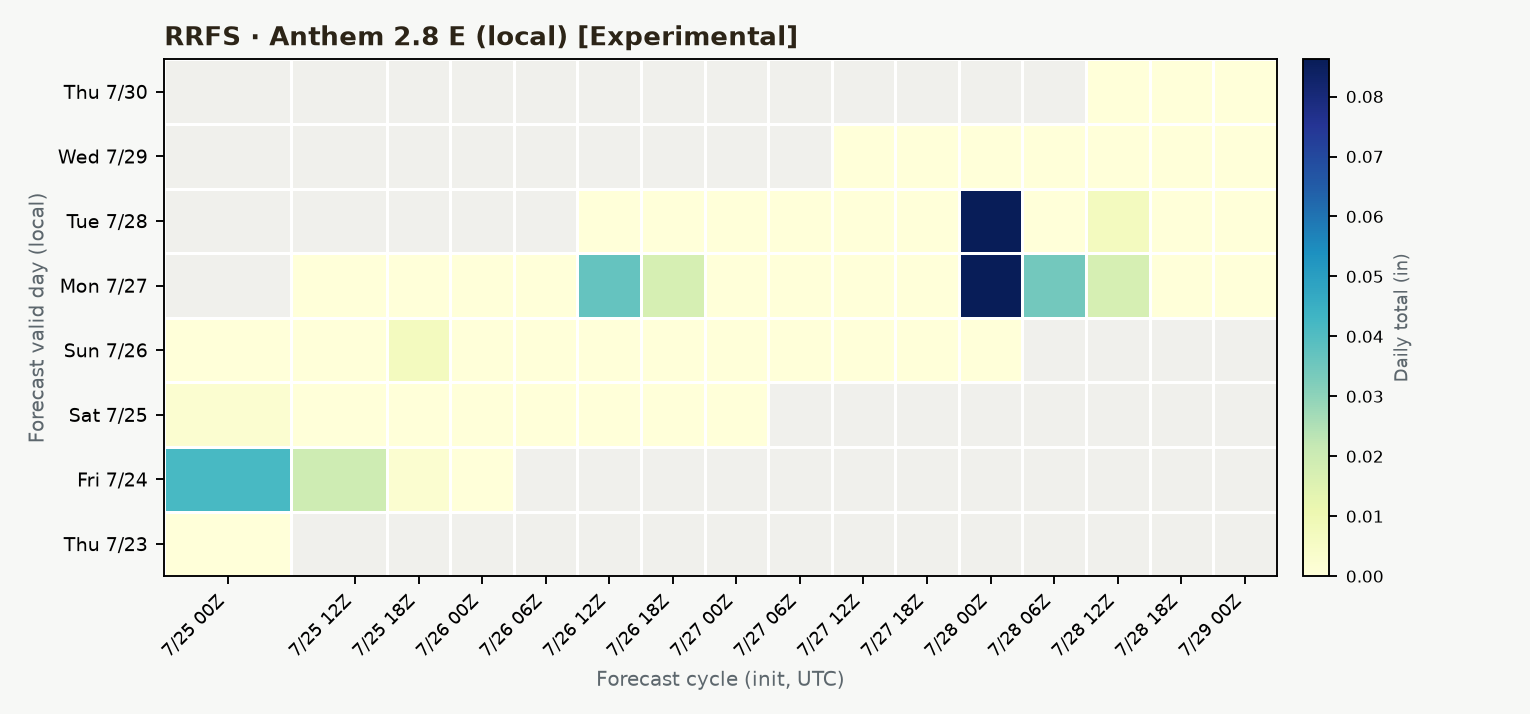
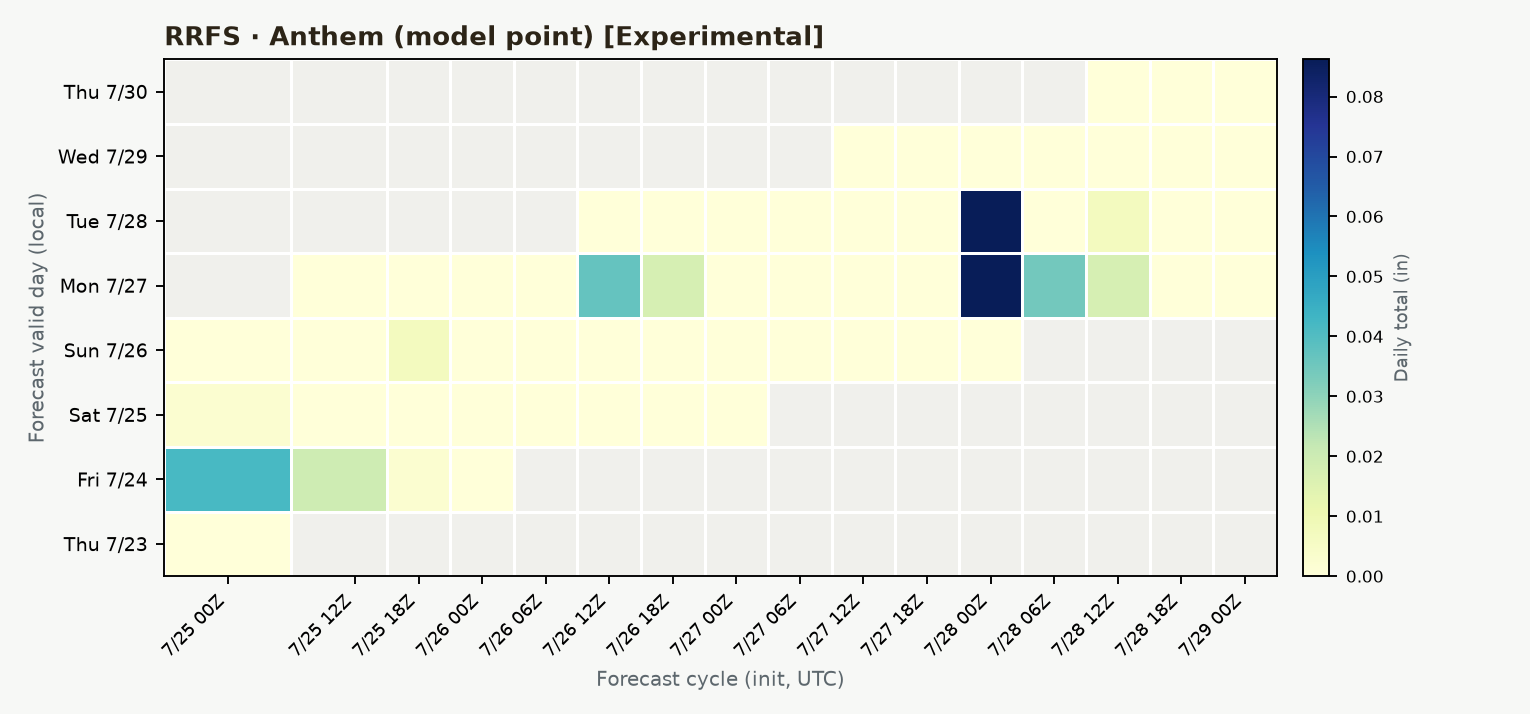
Each heatmap compares how one model has forecast daily precipitation for one site across every forecast cycle it's run recently. The x-axis is the forecast cycle (when the run started); the y-axis is the actual calendar day being forecast for; color is that cycle's predicted total precipitation for that day. Reading across a row shows how the forecast for one specific day changed as it got closer — whether a model was consistent about a coming rain event from run to run, or whether its guess swung around before settling down. This is a model-comparison and QA tool, not a forecast in its own right — for the actual outlook, see the per-location Short-Range Outlook pages.
This product launched with HRRR, RRFS, and REFS all fetching live — RRFS and REFS are brand new NOAA modeling systems still in pre-operational testing, so their heatmaps here will start as a thin sliver of cells and fill in over the coming days and weeks as more forecast cycles accumulate, the same way every other heatmap on this site did.
8 of 8 sites reporting • up to 14 forecast cycle(s) accumulated so far
8 of 8 sites reporting • up to 15 forecast cycle(s) accumulated so far
8 of 8 sites reporting • up to 14 forecast cycle(s) accumulated so far