
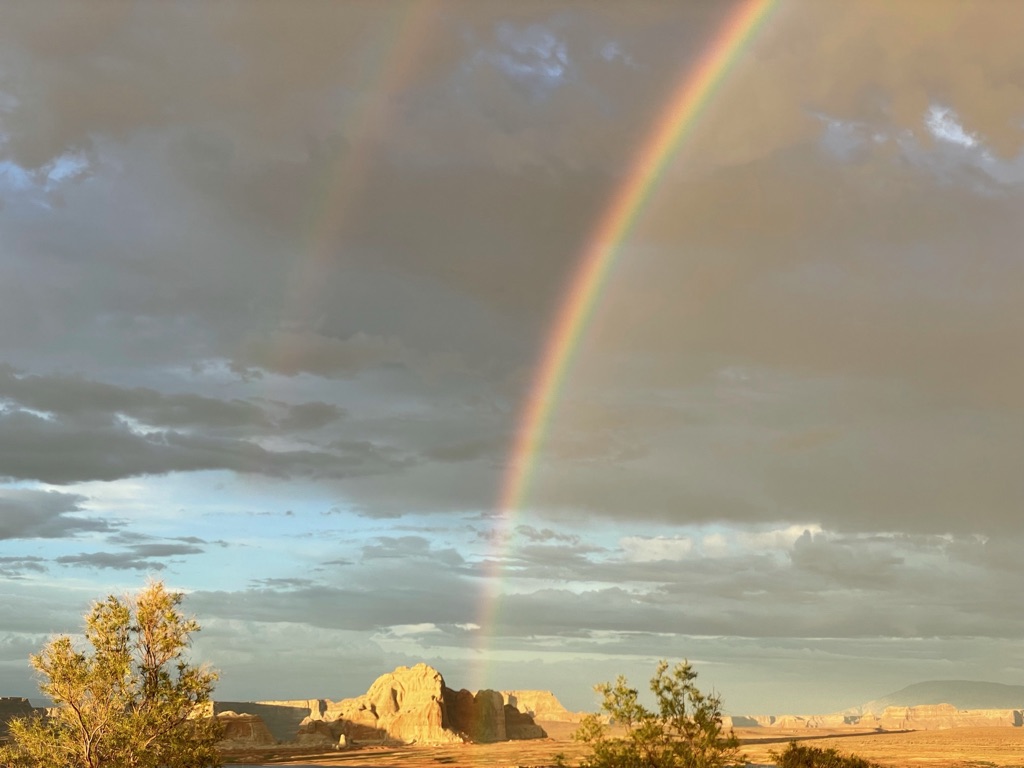
The climate history of the Southwestern United States extends back thousands of years, far beyond the region’s written historical record, which begins only a few hundred years ago with the earliest Spanish expeditions into the region in the late 1530s and 1540s (American Southwest Virtual Museum, 2019). Human societies have inhabited the region for thousands of years (Science of the American Southwest, 2014), growing and declining alongside repeated, sometimes decades-long alternations between severe drought and unusually wet “pluvial” periods — a recurring pattern researchers have linked to major transformations among the region’s indigenous societies (Cook et al., 2022; Cook et al., 2025; Benson et al., 2007).
Researchers draw on several types of physical evidence to reconstruct this history. Speleothems — stalactites, stalagmites, and flowstone deposited layer by layer in caves such as Carlsbad Caverns, New Mexico — preserve a record of past wetness dated by uranium–thorium methods. Tree-ring chronologies, cross-dated to an exact calendar year through pattern-matching alone, without reliance on radiocarbon dating, provide the most precisely dated evidence and underlie many of the specific decade-by-decade events described below. Supporting evidence comes from fossil pollen preserved in lake sediments, analyzed using the Modern Analog Technique (Overpeck et al., 1985); charcoal trapped in cave ice, interpreted as residue from fires Ancestral Puebloans set to melt the ice during dry periods (Onac et al., 2020); and lake sediment cores, whose grain size and carbon-to-nitrogen ratios track rainfall-driven runoff (Conroy et al., 2008).
The best-documented episodes include the Medieval Climate Anomaly (roughly AD 900–1300), whose megadroughts culminated in the late-13th-century “Great Drouth” (Cook et al., 2007); the Little Ice Age’s “Super Drought” (AD 1350–1650), identified from a Carlsbad Cavern speleothem record as the most severe and prolonged dry episode in the region’s past 1,400 years (Asmerom et al., 2013); a widely documented late-16th-century megadrought; and an ongoing megadrought beginning around 2000 that tree-ring-based reconstructions identify as the region’s driest 22-year span since at least 800 CE (Williams et al., 2022). What drives these events, especially the medieval megadroughts, remains an actively debated question. A leading hypothesis centers on a persistent La Niña-like state in the tropical Pacific (Seager et al., 2005; Herweijer et al., 2007), disputed by a later review that instead treats internal variability in sea-surface temperatures as the primary driver (Cook et al., 2016), with a subsequent modeling study attributing up to 30% of decadal drought variability to a combination of cold La Niña-like and warm Atlantic sea-surface temperatures (Steiger et al., 2019). Anthropogenic climate change is estimated to account for 42% of the 2000–2021 drought’s soil-moisture severity (Williams et al., 2022).
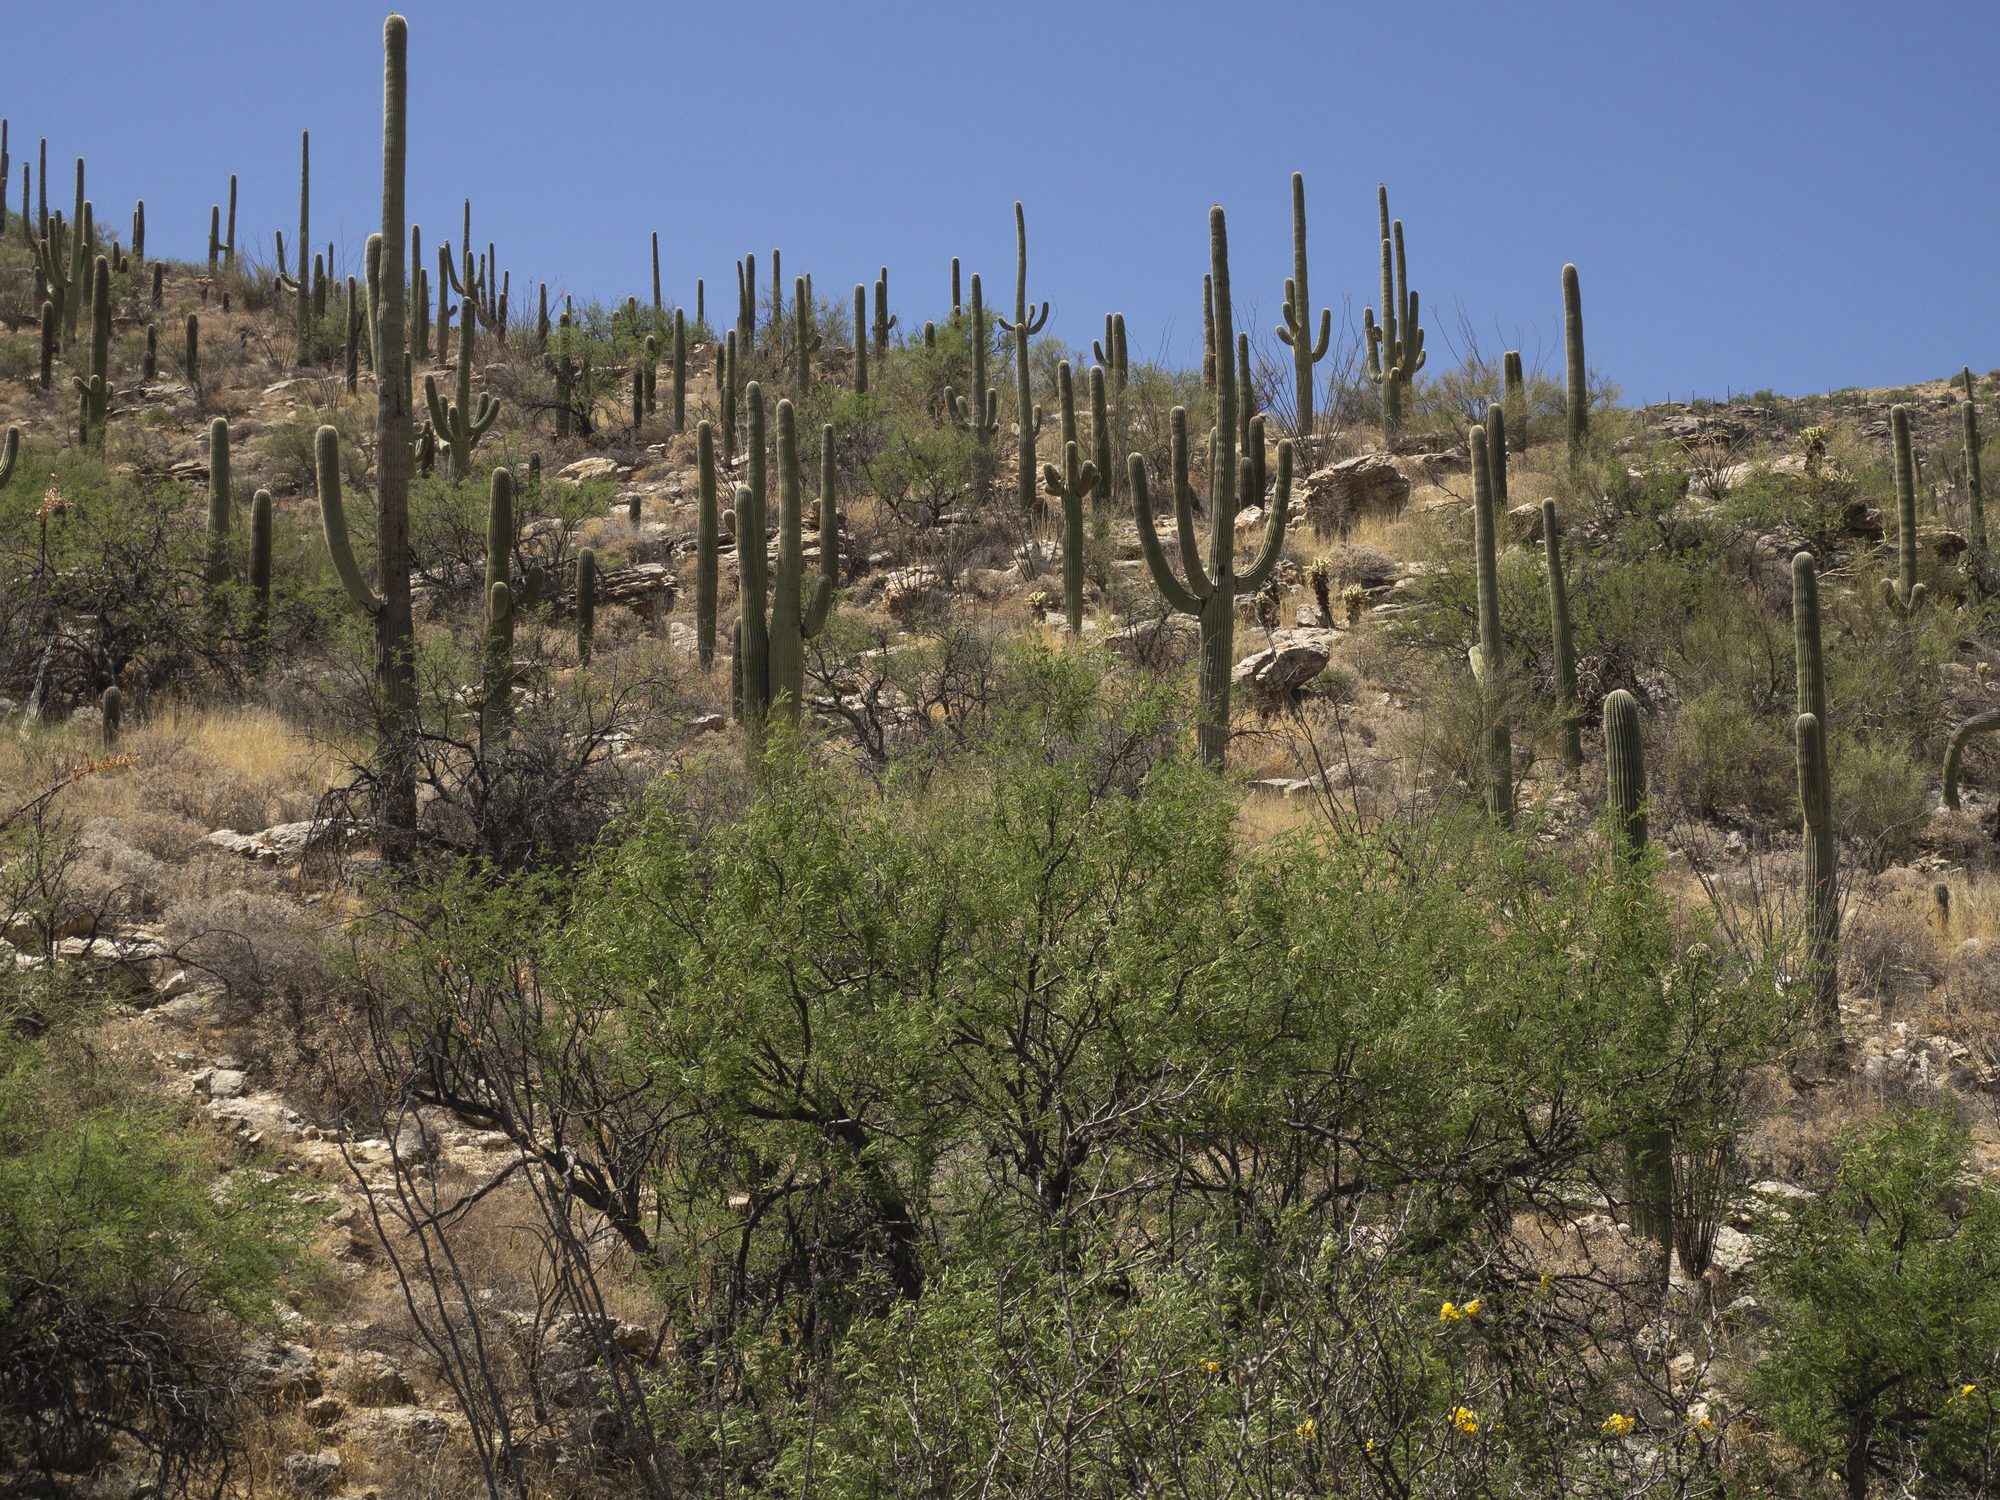
Late Pleistocene and early Holocene background
Three studies from the same New Mexico cave-research group cover this period, though not without gaps between them.
The oldest study examined the last Ice Age, from about 56,000 to 11,000 years ago. It found that cold spells in the Northern Hemisphere brought wetter winters to the Southwest, the opposite of what might be expected, because storm tracks shifted south during these cold periods. At the same time, monsoon rains in Asia grew drier. The researchers believe this opposite pattern was a real, connected effect, not a coincidence (Asmerom et al., 2010).
A second study, read here from the author’s pre-publication draft (so exact figures may differ slightly from the final published version), examined the opening of the Holocene, the current geological era spanning roughly the last 11,700 years. It found that the Southwest’s Holocene began warm and wet, not dry. Conditions stayed that way until about 9,500 years ago, when they shifted into a roughly 2,500-year dry interval the study’s authors term the Southwest’s “Altithermal.” (Polyak et al., 2025). This is not the same event as the similarly named “Altithermal” used for the Great Basin (Nevada and Utah). The two differ in location, timing, and underlying cause.
An earlier study by much of the same research group used a different cave, Pink Panther Cave, but the same kind of stalagmite mineral evidence. Its record runs through the entire Holocene, back to about 12,300 years ago (Asmerom et al., 2007). Its finding backs up the Altithermal study above: the early Holocene, especially the stretch ending around 7,000 years ago, comes out as the driest chunk of the entire Holocene record in this cave’s data. Wetter conditions return afterward. This earlier study is actually the underlying record the newer Altithermal paper draws on, so it is not a fully independent confirmation. Both papers read the same evidence the same way. It is included here because it is already cited elsewhere in this article, and because it shows the dry stretch as an extreme in the actual numbers, not just as a general pattern.
Evidence base
Researchers draw on several types of physical evidence to reconstruct the region’s climate history.
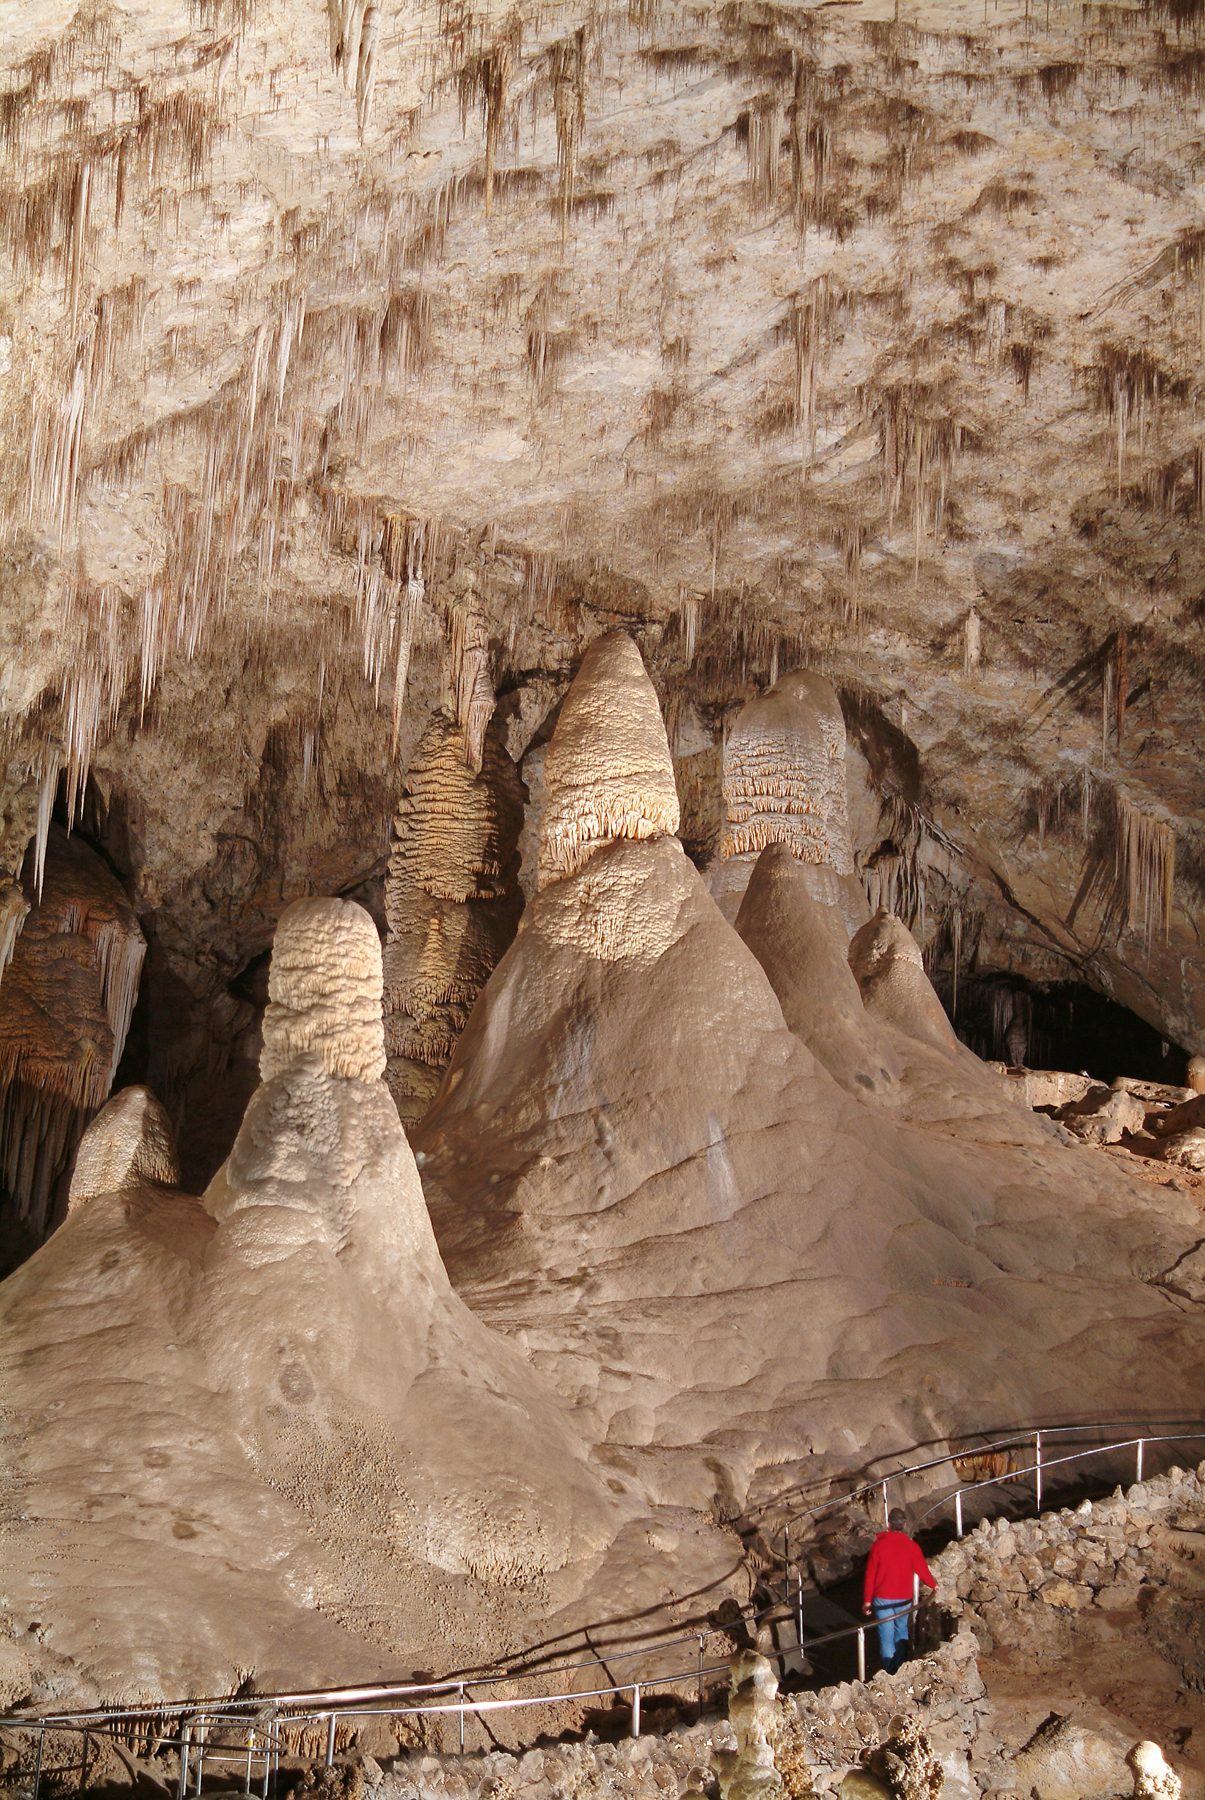
- Speleothem records: A speleothem is a mineral formation that grows within a cave, including features such as stalactites, stalagmites, and flowstone deposits. Speleothems form as water percolates through the overlying rock, dissolving minerals along the way, then deposits a thin mineral layer inside the cave as it drips, flows, and evaporates. These layers accumulate sequentially over time, in a manner comparable to tree rings. The chemical composition and growth rate of each layer vary with the amount of water moving through the rock above the cave, which reflects how wet or dry surface conditions were at the time of deposition. By extracting and analyzing a core sample through a stalagmite, researchers can measure these layer-by-layer variations to reconstruct past periods of relative wetness and aridity, in some cases spanning tens of thousands of years, with precise dating provided by uranium–thorium dating.
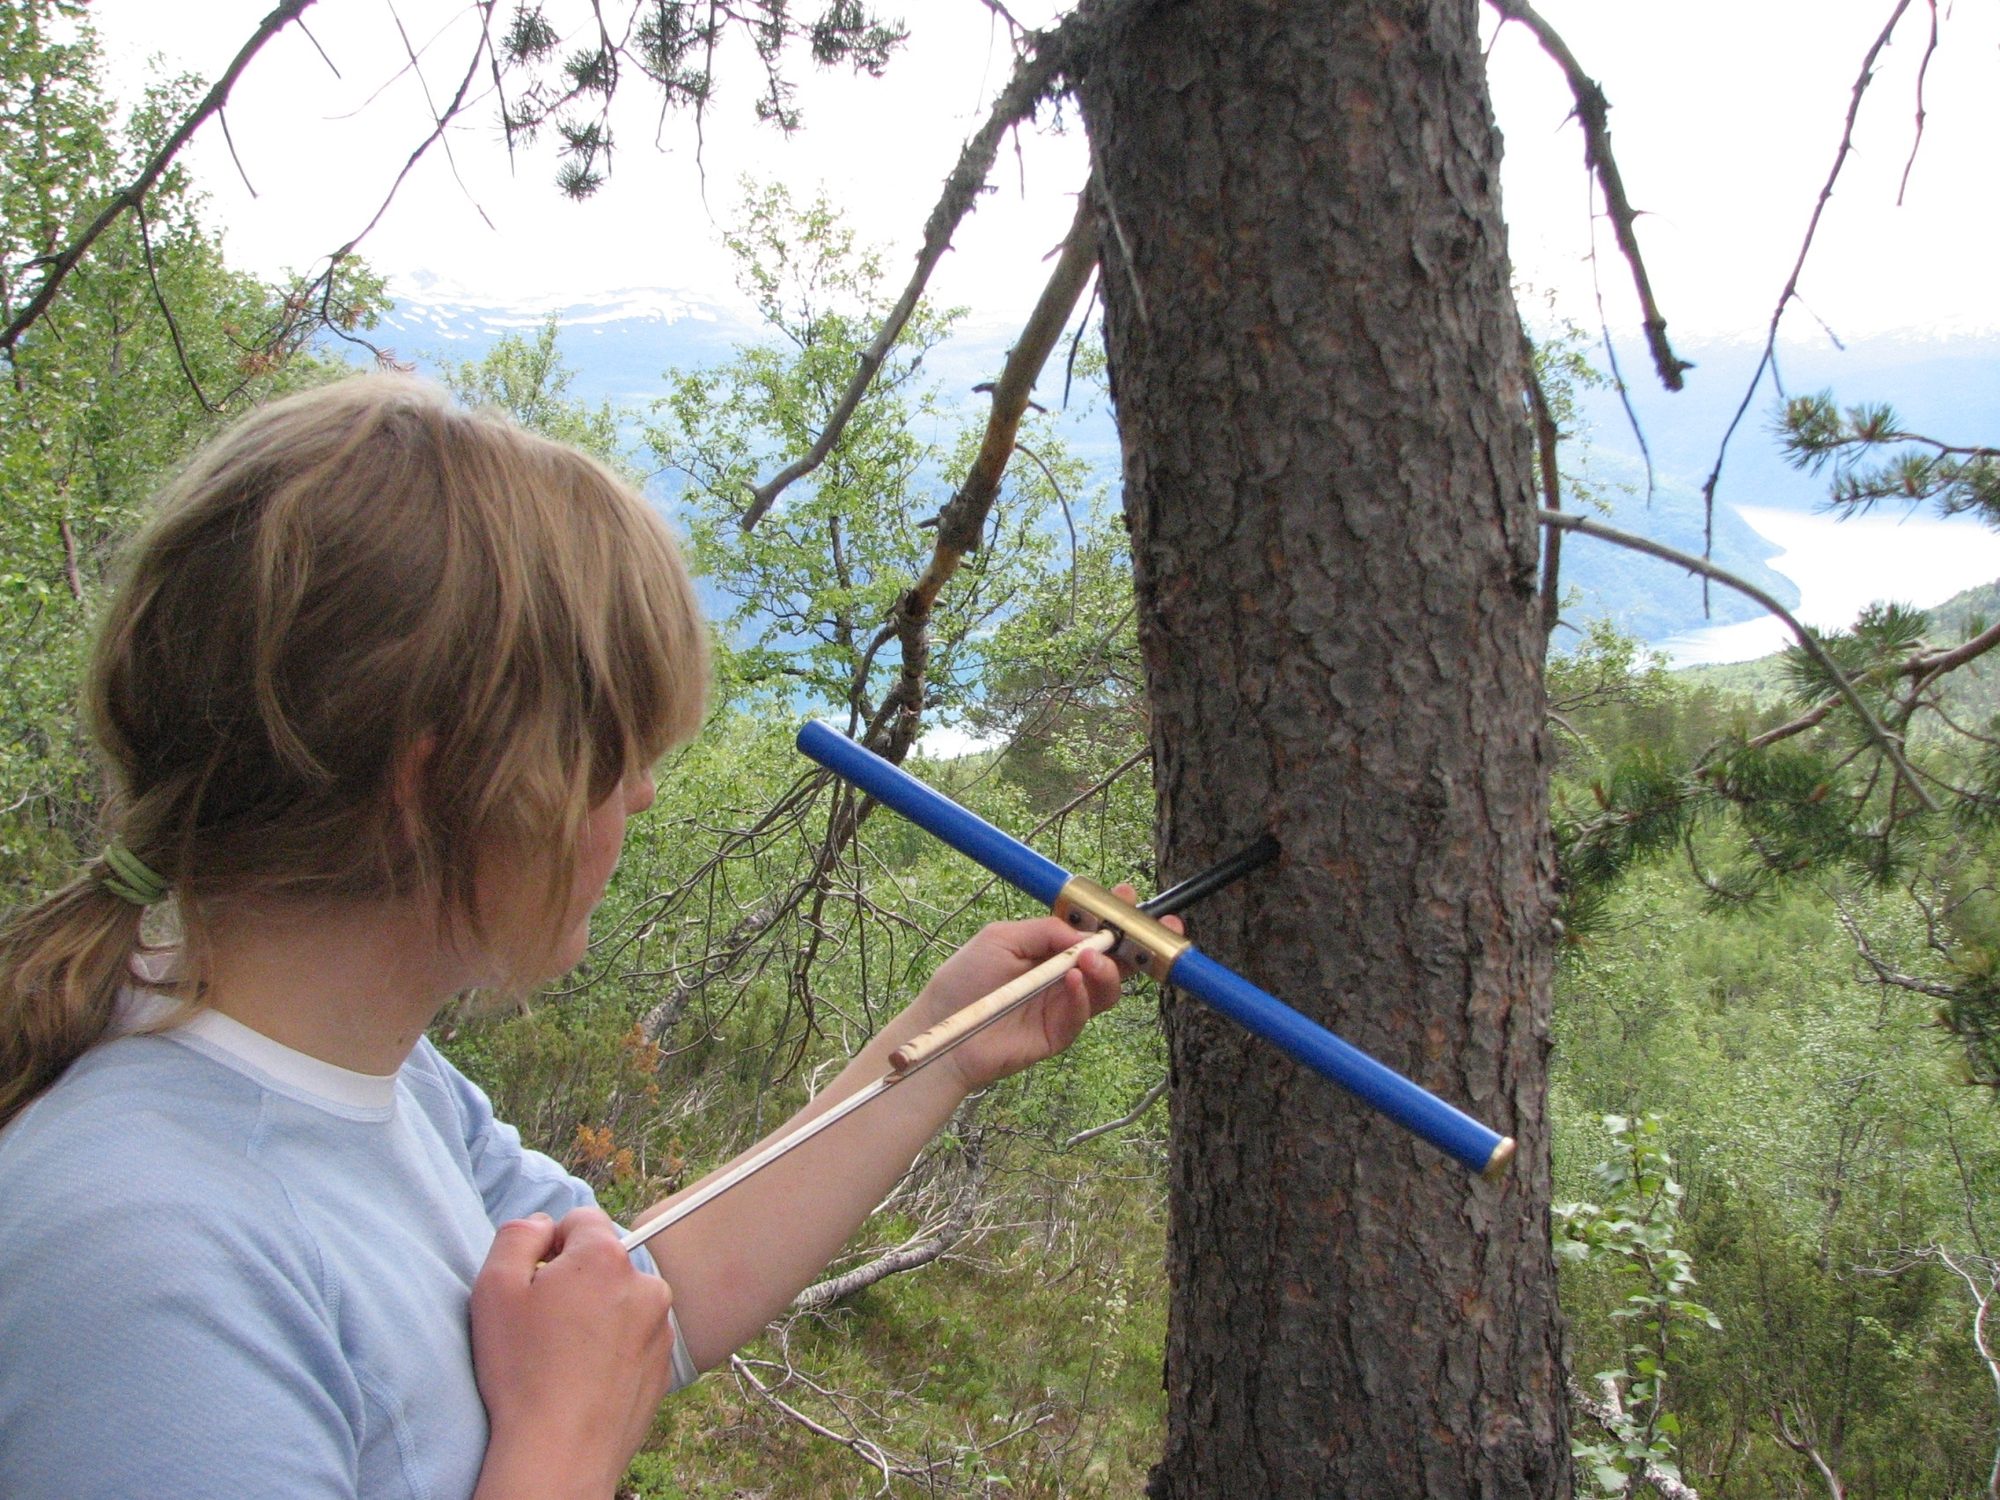
- Tree-ring records: Trees in seasonal climates generally lay down one visible ring each year, reflecting a growth season followed by winter dormancy. In arid and semi-arid regions such as the Southwest, water availability tends to be the main factor limiting that year’s growth, so ring width there tracks moisture especially closely: wider rings in wet years, narrower rings in dry ones. Researchers build long, continuous, year-by-year chronologies through cross-dating, matching the distinctive pattern of wide and narrow rings across living trees, dead wood, and archaeological timbers, chaining backward from the present. Because each year’s growing conditions leave a recognizable regional fingerprint in that year’s ring, samples can often be matched to an exact calendar year through this pattern-matching alone, without relying on radiocarbon dating. Several research teams in our source list used tree-ring chronologies built this way to reconstruct drought and soil-moisture conditions, and they are the backbone of many of the more precisely dated events later in the article, specific decade-by-decade droughts rather than only centuries-long trends.
- Fossil pollen: Fossil pollen preserved in lake sediments gives researchers another way to reconstruct past conditions. Pollen grains have a tough outer coating that resists decay for thousands of years, especially in low-oxygen lake-bottom mud, and different plant species produce pollen with distinctive, identifiable shapes. Researchers drill a sediment core, examine pollen layer by layer, and assign each layer a calendar date using radiocarbon dating of organic material preserved in the sediment. Comparing an ancient pollen assemblage to modern plant communities with known climates, a method called the Modern Analog Technique (Overpeck et al., 1985), lets researchers estimate the climate of a dated layer. Two Southwest-specific studies in our source base use this method: one reconstructs past temperature (Gillreath-Brown et al., 2024), and the other uses piñon pine pollen specifically as an indicator of past moisture, since piñon pine is especially sensitive to water availability, a species many Southwest readers will recognize firsthand (Jiménez-Moreno et al., 2021). A related, continental-scale study using the same method notes that dry, desert regions such as parts of the Southwest are generally harder to reconstruct this way, due to fewer available samples and less-constrained dating than wetter regions provide (Viau et al., 2012), so pollen evidence works best here as supporting evidence alongside the stronger cave and tree-ring records.
- Cave ice and charcoal: Charcoal preserved in cave ice deposits offers a different kind of evidence: a human-behavior record rather than a direct natural-climate measurement. Researchers radiocarbon-date charcoal trapped within layers of ice, interpreting it as residue from fires Ancestral Puebloans set to melt the ice for drinking water during dry periods (Onac et al., 2020). An on-site pottery artifact, nearby archaeological structures, and ethnographic accounts of cave ice as a valued water source support that interpretation beyond the layering alone. This method dated five separate drought episodes to roughly AD 150 to 950, extending the region’s known drought history earlier than the named megadroughts covered later.
- Lake sediment cores: Lake sediment cores provide another type of physical evidence. This method has been applied to crater lakes without permanent streams, where most sediment washes in only during heavy rain events. Researchers measure grain size and the ratio of carbon to nitrogen within each sediment layer: coarser, more mineral-rich layers indicate heavier rain-driven runoff, associated with El Niño conditions, while finer, more organic layers indicate calmer, drier conditions. Layers are dated using a combination of methods depending on depth: lead- 210, anchored to known reference points, for the most recent centuries, and radiocarbon dating, calibrated to calendar years, for older material further down the core (Conroy et al., 2008).
Terminology
The term “megadrought” is not precisely defined in the scientific literature, as one widely cited review states directly (Cook et al., 2016). The other terms used throughout this article, drought, pluvial, and megapluvial, are also used with varying definitions across the sources this article cites.
Megadrought is most often described as exceeding a decade in duration and exceeding the severity of anything recorded in the 19th or 20th century instrumental record, but the specific threshold varies by source (Cook et al., 2016). The same review cites both “longer than a decade” and a separate study’s “15 years or longer” as differing figures for the same term (Cook et al., 2016). Another study defines megadrought using its own operational threshold: an anomaly of at least 19 years that is at least 0.25 standard deviations more negative than anything observed in the 20th century (Williams et al., 2020).
Definitions of “drought” without the “mega-” prefix, when stated explicitly, do not consistently fall below this decadal scale either. One study defines drought generally, not specifically megadrought, as persisting for a decade or more (Woodhouse et al., 2010). A separate study’s own drought-detection method requires at least ten consecutive years of below-average conditions before classifying an event as a drought at all, reserving “megadrought” for anomalies of at least 19 years that are at least 0.25 standard deviations more negative than anything observed in the 20th century (Williams et al., 2020).
A similar pattern holds for wet periods. The same 2025 study that defines “megapluvial” also gives an explicit numeric definition for “pluvial” without the “mega-” prefix: strings of ten or more years above a long-term moisture baseline, with events shorter than five years excluded (Cook et al., 2025). For “megapluvial” itself, the study does not state an independent duration threshold. Instead, it defines megapluvials as wet periods distinguished by exceptional severity or persistence relative to other pluvials, without a fixed numeric standard. Its two named 20th-century examples, 19 and 22 years respectively, result from applying that comparative standard rather than a duration requirement built into the definition itself (Cook et al., 2025).
Because of this variation, duration and severity figures cited elsewhere in this article reflect the specific criteria used by the source being cited, rather than a single standard applied consistently throughout.
Dating and duration
Southwest climate history alternates between extended wetter intervals and extended drier ones, but reconstructions do not always agree on exactly when one gives way to the other. A stalagmite record from the Guadalupe Mountains of southern New Mexico shows an extended wet interval beginning around 1050 BCE and gives two different dates for when it ended: about 740 CE in one study, and about 1150 CE, roughly four centuries later, in an earlier study by some of the same researchers using different stalagmites from the same cave system (Polyak et al., 2022; Polyak & Asmerom, 2001).
By the height of what is now generally called the Medieval Climate Anomaly, tree-ring and streamflow records document several Southwest-wide megadroughts. Southwest-focused hydroclimate studies place this period at roughly AD 900 to 1300, a range defined by regional drought patterns rather than the temperature-based framing more often used for the Medieval Warm Period elsewhere. This regional approach follows the explicit recommendation of a broader review of global temperature reconstructions, which found no evidence that conventionally-named climate epochs like the Medieval Climate Anomaly and Little Ice Age were globally synchronous: “we advocate for a regional framing for understanding climate variability of the pre-industrial Common Era.” (Neukom et al., 2019). The best documented is the “Great Drouth,” (the term “drouth” is a historical variant spelling and pronunciation of “drought,” documented in regional American English through the mid-20th century, and is not a misspelling; Merriam-Webster, n.d.) which tree-ring cutting dates from Chaco Canyon and Mesa Verde place as beginning in AD 1276 and ending somewhere between 1297 and 1300, depending on the source (Cook et al., 2007). This period also includes a separate, shorter megadrought in the mid-1100s, and overlaps with two much longer “Stine droughts,” most associated with California and Nevada: roughly AD 832 to 1074 and AD 1122 to 1299, separated by a 47-year pluvial (Cook et al., 2010). A related reconstruction places the first drought’s onset 30 years later, in AD 862 (Cook et al., 2016). These long droughts are geographically and, apparently, causally distinct from the shorter Southwest-wide megadroughts described above: the shorter droughts match the same La Niña-like tropical sea-surface-temperature pattern seen in the modern Southwest’s drought, while, in the words of the study that redated the Stine droughts, “tropical ocean forcing cannot explain the continental patterns” of the longer ones (Cook et al., 2010).
The Little Ice Age, though cooler overall, was not simply wetter: a speleothem record from Carlsbad Cavern, New Mexico, identifies a “Super Drought” spanning AD 1350 to 1650 as the most severe and prolonged dry episode in the region’s past 1,400 years, more severe even than anything recorded during the Medieval Climate Anomaly (Asmerom et al., 2013). The same record also names a shorter, later “Pueblo Revolt Drought,” a summer drought accompanied by unusually long, snowy winters, peaking in AD 1660–1670 and coinciding with the Maunder Minimum in solar activity (Asmerom et al., 2013).
Extended pluvials and megadroughts continued to alternate after 1650. A widely documented megadrought struck the Southwest in the late 16th century, with reconstructions placing its span anywhere from 1570 to 1600 depending on the specific method and study (Williams et al., 2020). Pluvials bracketed this drought closely in time: one in the mid-16th century, another from 1594 to 1621, and a further one in the early 1800s, from 1825 to 1840 (Cook et al., 2025). In the 20th century, two more extended pluvials, from 1905 to 1923 and from 1978 to 1999, were followed by a modern megadrought beginning around 2000. The 2000–2021 megadrought is close enough in severity to the late-16th-century megadrought that the two overlap within the reconstruction’s own statistical uncertainty (Williams et al., 2022). Tree-ring-based soil-moisture reconstructions still identify 2000–2021 as the driest 22-year span in the Southwest since at least 800 CE (Williams et al., 2022).
Competing date ranges at a glance
The prose above explains why these dates diverge; this list collects the specific competing date ranges in one place, grouped where multiple sources describe what is treated as the same underlying event.
- Early droughts, Cave 29: five separate episodes, roughly AD 150–950 — radiocarbon-dated charcoal in cave ice (Onac et al., 2020)
- Wet interval, Guadalupe Mountains stalagmite record: beginning around 1050 BCE, ending about 1150 CE in one study (Polyak & Asmerom, 2001) or about 740 CE in a later study using different stalagmites from the same cave system (Polyak et al., 2022)
- “Pluvial-like” interval, same cave system: 1400 BCE to 740 CE, followed by a markedly more arid, highly variable regime lasting from about 740 CE to 1630 CE (Polyak et al., 2022)
- Elevated Medieval Climate Anomaly-era aridity, four driest individual years: AD 936, 1034, 1150, and 1253 (Cook et al., 2004)
- Early-11th-century Southwest/Rockies megadrought: AD 1021–1051, one of three such droughts the same analysis identifies for the period (Herweijer et al., 2007)
- Mid-13th-century Southwest/Rockies megadrought: AD 1240–1265, a second of that same trio (Herweijer et al., 2007)
- Mid-1100s drought — six competing date ranges for the same event (the trio’s third member):
- AD 1130–1154 (driest 25-year window), 1118–1179 (broader 62-year span) — Colorado River streamflow reconstruction (Meko et al., 2007)
- AD 1130–1136 and 1150–1158, two shorter “perfect droughts” — multi-basin tree-ring reconstruction (Meko et al., 2022)
- AD 1130–1170 — gridded North American Drought Atlas reconstruction (Herweijer et al., 2007)
- AD 1130–1177, labeled “D3” — tree-ring cutting dates combined with a Palmer Drought Severity Index reconstruction (Benson & Berry, 2009)
- AD 1135–1170 — Palmer Drought Severity Index reconstruction (Benson et al., 2007)
- AD 1130–1180 — maize-productivity model (Benson et al., 2013)
- Late-13th-century “Great Drouth” — competing end dates from roughly the same 1276 start:
- 1276–1299 — original Douglass tree-ring chronology (Cook et al., 2007)
- 1276–1297 — Palmer Drought Severity Index reconstruction (Benson et al., 2007)
- 1273–1297, labeled “D4” (the earliest start date given by any source) — tree-ring cutting dates combined with a Palmer Drought Severity Index reconstruction (Benson & Berry, 2009)
- 1276–1300 — maize-productivity model (Benson et al., 2013)
- 1271–1300 — as cited from Benson et al., 2007 by a later paper (Cook et al., 2025), though this does not match the 1276–1297 range that source gives in its own text
- Late-16th-century megadrought — competing date ranges:
- 1575–1593 — gridded tree-ring Palmer Drought Severity Index reconstruction (Williams et al., 2020)
- 1570–1587 — gridded tree-ring Palmer Drought Severity Index reconstruction (Fye et al., 2003)
- 1579–1600, the Colorado River “Severe Sustained Drought” planning scenario — streamflow reconstruction (Meko et al., 2022)
- 1573–1593 — dendrochronologist Edmund Schulman’s original 1945 dating (Meko et al., 2022)
- Little Ice Age “Super Drought”: AD 1350–1650 — speleothem record, Carlsbad Cavern (Asmerom et al., 2013)
- Dry, no-growth interval, Guadalupe Mountains: roughly AD 1280–1490 — speleothem (Polyak & Asmerom, 2001)
- Pueblo Revolt Drought: AD 1660–1670 — speleothem, Carlsbad Cavern (Asmerom et al., 2013)
- “Stine droughts” (California–Nevada), long megadroughts distinct from the shorter Southwest-wide events above:
- roughly AD 832 to 1074 and AD 1122 to 1299, separated by a 47-year pluvial — tree-ring Palmer Drought Severity Index reconstruction (Cook et al., 2010)
- the first drought’s onset placed 30 years later, in AD 862, by a related reconstruction (Cook et al., 2016)
- Pre-1900 pluvial: 1549–1570, per one source’s citation of another (Cook et al., 2025), though the cited source’s own text gives a shorter 1549–1558 pluvial (Fye et al., 2003) — see prose above
- Pre-1900 pluvial: 1594–1621 (Cook et al., 2025, citing Robeson et al. 2020)
- Pre-1900 pluvial: 1825–1840 (Cook et al., 2025, citing van der Schrier & Barkmeijer 2007)
- 20th-century pluvial: 1905–1923 (Cook et al., 2025)
- 20th-century pluvial: 1978–1999 (Cook et al., 2025)
- Modern megadrought: 2000–2021, the driest 22-year period since at least 800 CE — gridded soil-moisture reconstruction blended with the instrumental record (Williams et al., 2022)
Before the Pueblo period
The Pueblo period, the era of ancestral Puebloan culture in the region, is conventionally dated from about 700 to 1540 CE (Polyak et al., 2022).
A stalagmite record from Hidden Cave in the Guadalupe Mountains of southern New Mexico, spanning roughly 3,400 years, provides the longest continuous proxy record available for the region’s precipitation history (Polyak et al., 2022). The record uses shifts in the stalagmite’s mineral composition, between calcite and aragonite, as an indicator of wetter and more arid conditions respectively (Polyak et al., 2022). It shows that conditions from at least 1400 BCE to around 740 CE were comparatively pluvial-like, before shifting to a markedly more arid and highly variable climate regime that persisted from about 740 CE to 1630 CE, an interval the study’s authors describe as the most arid and variable of the entire 3,400-year record (Polyak et al., 2022). This drier regime is coeval with the entire pre-Hispanic Pueblo cultural period in the region, and its onset corresponds with the broader transition from Desert Archaic and Basketmaker cultures to Pueblo cultures (Polyak et al., 2022).
A related, earlier study by some of the same researchers, using five stalagmites from the same Guadalupe Mountains cave system (Carlsbad Cavern and Hidden Cave), reconstructed a similar span of the region’s climate history in more detail. It found a present-day-like climate from about 4,000 to 3,000 years ago, following an earlier drier middle-Holocene stretch, then a distinctly wetter and cooler period lasting from about 3,000 to 800 years ago, most pronounced between roughly 3,000 and 1,700 years ago, with an intervening drier stretch around 1,700 to 1,300 years ago that overlaps the Basketmaker III period (Polyak & Asmerom, 2001). Because both studies share authors and draw on the same site cluster, this later date for the same wet-to-arid transition, about 1150 CE rather than 740 CE, is not an independent confirmation or contradiction so much as an internal disagreement between two records built from different individual stalagmites, not yet resolved.
This pre-740 CE portion of the region’s precipitation history, as presented here, is drawn primarily from these two speleothem records; most other reconstructions used elsewhere in this article, based on tree-ring chronologies, do not extend reliably earlier than about 800 CE. A separate, independent piñon pine (Pinus edulis) pollen record from the Southern Rockies broadly agrees with the timing of the subsequent shift into a sustained arid regime around 740–800 CE, but shows its own centennial-scale dry episodes within this earlier span, and should not be read as confirming it was uniformly wet throughout (Jiménez-Moreno et al., 2021). A separately derived summer-temperature reconstruction from 29 fossil pollen sites across the region is consistent with wetter conditions persisting through roughly 1 CE to 500 CE, inferred indirectly from an associated cool interval the study attributes to a prolonged dominance of El Niño-like conditions, which are linked to higher precipitation in the Southwest; the same reconstruction also shows warmer, El Niño-like-absent intervals around 1400 BCE and 700–1 BCE that would imply drier excursions within the same span (a Galápagos lake-sediment record, Conroy et al. 2008, independently places peak Holocene tropical Pacific ENSO variance at roughly 50 BCE–450 CE, within this same window — a possible third line of corroborating evidence to check and verify before citing here) (Gillreath-Brown et al., 2024). Because this second study reconstructs temperature rather than precipitation directly, its bearing on the region’s wetness during this period is indirect, not a direct replication of the speleothem evidence. A related analysis by the same lead author, proposing an ENSO index derived from the same temperature record, places the onset of a persistent El Niño-like (cool, wetter-favoring) regime at around 1 CE and holds that it continued until approximately 1100 CE — several centuries later than the shift to sustained aridity that the speleothem record places around 740 CE, a discrepancy between the two lines of evidence that has not been resolved (Gillreath-Brown & Kohler, 2024).
Medieval Climate Anomaly
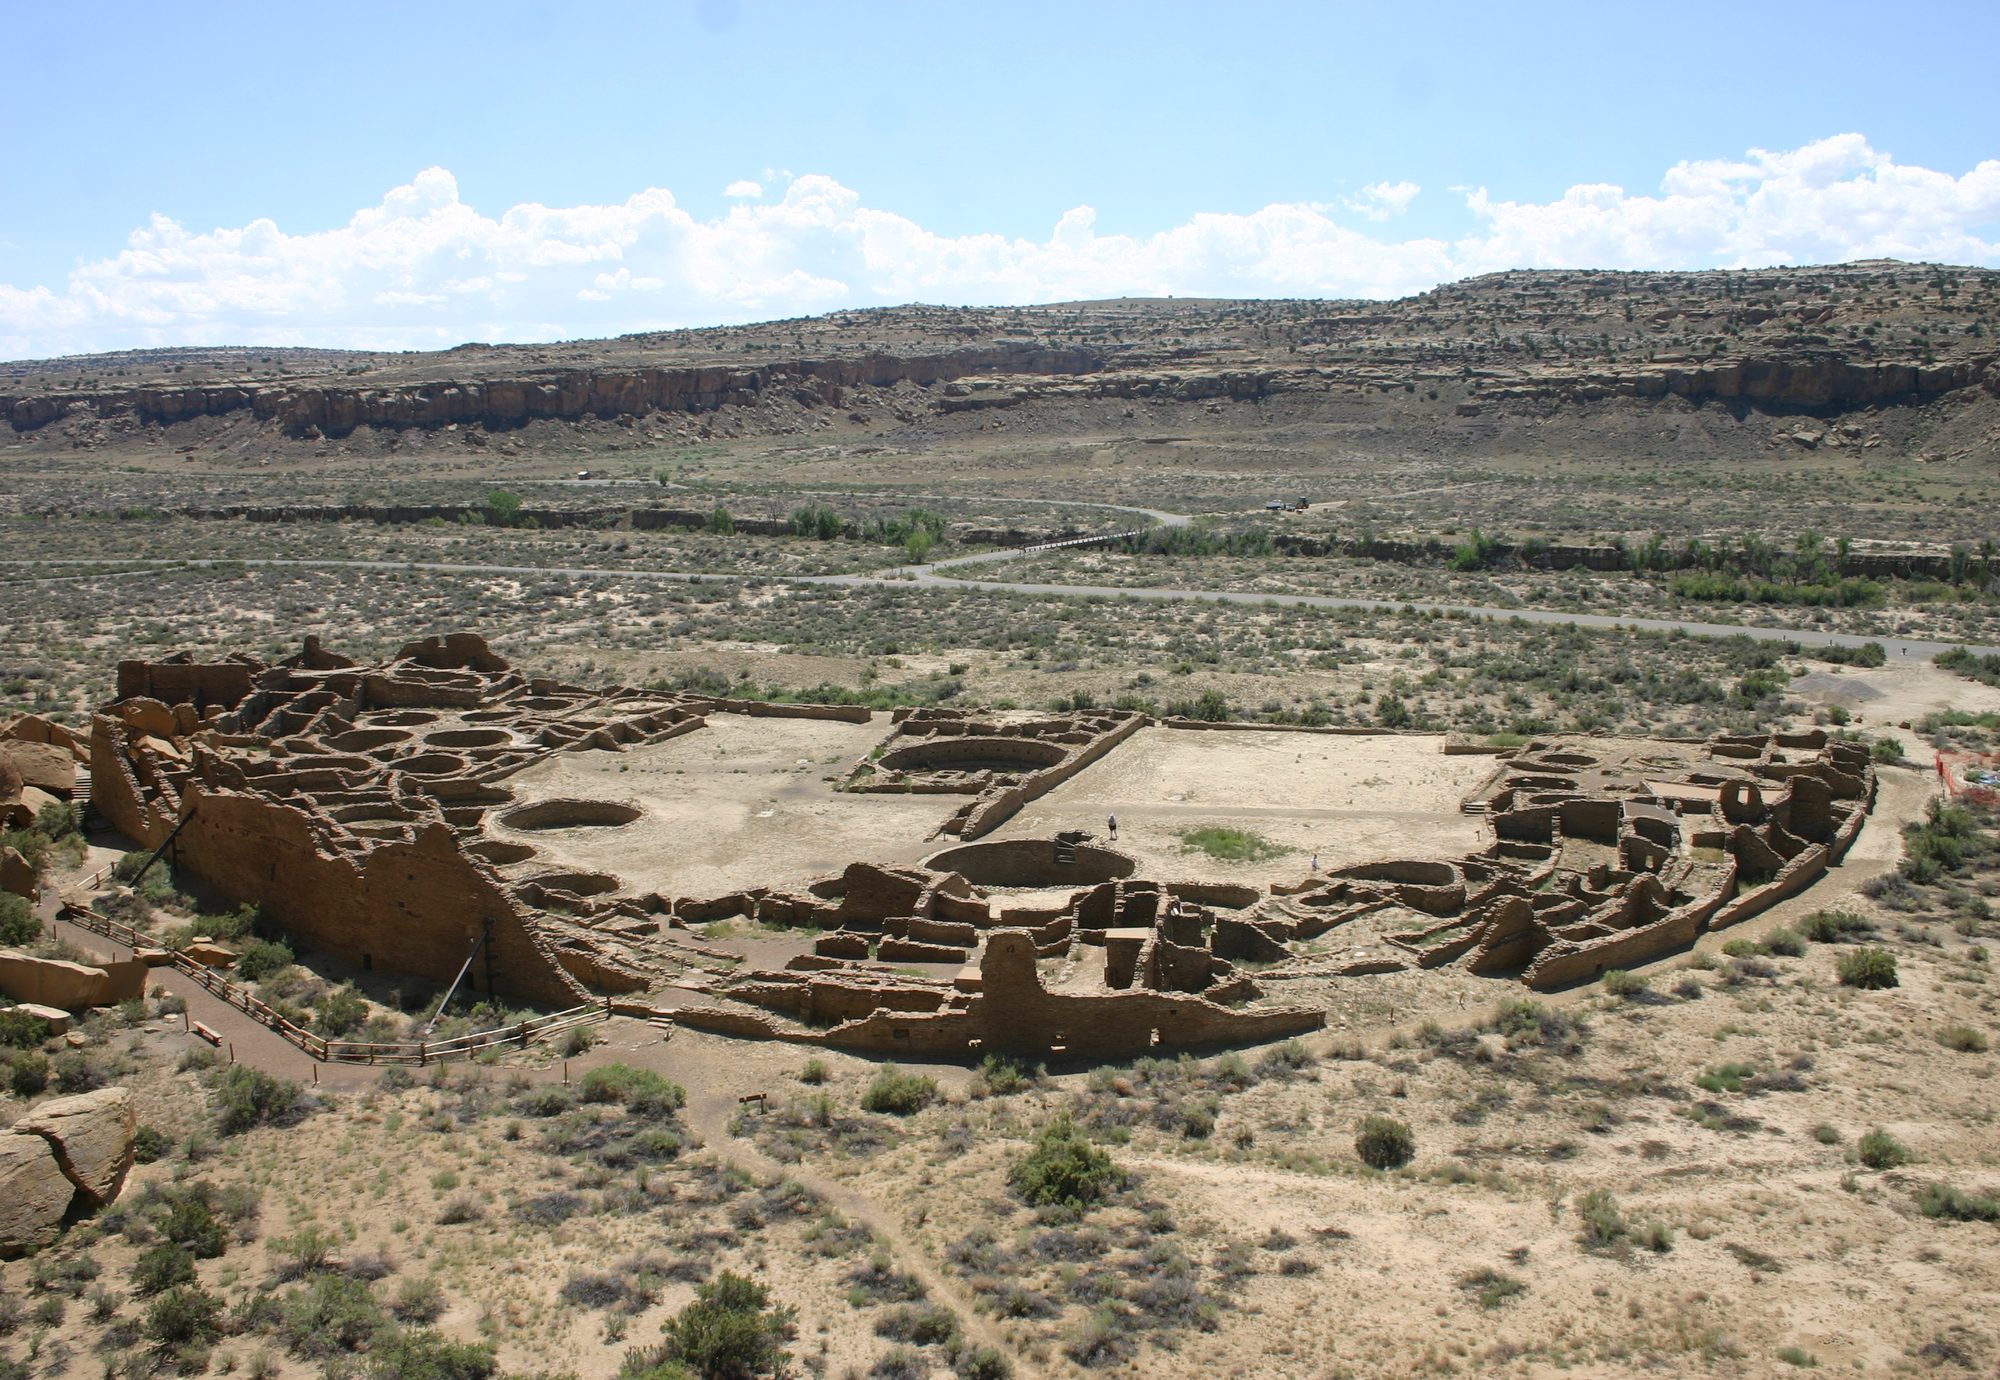
Elevated aridity during the Medieval Climate Anomaly (AD 900–1300) was not continuous. A gridded tree-ring reconstruction of the Palmer Drought Severity Index identifies four especially dry years within this broader period: AD 936, 1034, 1150, and 1253 (Cook et al., 2004). The second of these, 1034, falls within a longer early-11th-century megadrought that a separate gridded reconstruction dates to AD 1021 to 1051, one of three major Southwest and southern Rocky Mountains droughts the same analysis identifies for the period (Herweijer et al., 2007).
A drought centered on the mid-12th century is especially well documented, and especially inconsistently dated: six independent reconstructions agree that it began around AD 1130 but differ on when it ended, with end dates ranging from 1136 to 1180. A reconstruction of Colorado River streamflow finds its driest 25-year window at AD 1130–1154, embedded in a broader 62-year dry span from 1118 to 1179 (Meko et al., 2007). A later multi-basin study instead identifies two shorter “perfect droughts” — years of below-median flow across the Colorado River, Sacramento River, and southern California basins simultaneously — in 1130–1136 and 1150–1158 (Meko et al., 2022). A gridded reconstruction of the North American Drought Atlas dates the same event to 1130–1170 (Herweijer et al., 2007), while a study combining tree-ring cutting dates with a Palmer Drought Severity Index reconstruction dates it to 1130–1177, labeling it “D3.” (Benson & Berry, 2009). An earlier Palmer Drought Severity Index-based reconstruction by some of the same authors placed it at 1135–1170 (Benson et al., 2007), and a maize-productivity model incorporating precipitation, elevation, and soil nitrogen dated it to 1130–1180 (Benson et al., 2013).
The spread is not a sign that some of these studies are wrong. Regression-based tree-ring reconstructions systematically understate the driest years, a known effect called variance compression that follows from the tree-ring proxy correlating with, but not perfectly reproducing, actual moisture; studies also differ in whether they use standard or residual chronologies and in how densely their tree-ring networks sample the region, both of which change a reconstruction’s sensitivity to any given drought (Meko et al., 2022). Severity threshold alone can change a reported duration: the Colorado River reconstruction above finds a 62-year broad dry span containing a 13-year run of consecutive below-normal years (1143–1155) inside its driest 25-year window (1130–1154), three different figures for the same event depending on which threshold is applied (Meko et al., 2007). As the multi-basin study puts it, “it is impossible to prove that a given drought before the start of instrumented climate is more accurately represented by one reconstruction than by another.” (Meko et al., 2022).
The “Great Drouth” has produced almost as much disagreement over its precise end date as it has left evidence of its severity. Cook et al. 2007, using the original Douglass tree-ring chronology, dates it 1276–1299 (Cook et al., 2007); a Palmer Drought Severity Index reconstruction in Benson et al. 2007 dates it 1276–1297 (Benson et al., 2007); the same drought, labeled “D4” in Benson & Berry 2009’s combined tree-ring cutting-date and Palmer Drought Severity Index analysis, is dated 1273–1297, the earliest start date given by any source (Benson & Berry, 2009); and a maize-productivity model in Benson, Ramsey, Stahle & Petersen 2013 dates it 1276–1300 (Benson et al., 2013). A fifth figure, 1271–1300, appears in Cook et al. 2025’s own summary of Benson et al. 2007 — but this does not match the 1276–1297 range Benson et al. 2007 gives in its own text, and neither paper explains the gap (Cook et al., 2025).
Part of this spread is a same-author inconsistency rather than disagreement between independent studies: Larry Benson, first author of both the 2007 and 2009 papers above, published two different date ranges for the same drought two years apart, without reconciling the difference in either paper. Cook et al. 2025’s citation of Benson et al. 2007 as giving 1271–1300 is a further, separate discrepancy of the same kind — a later paper’s paraphrase of an earlier one’s finding that does not match what the earlier paper’s own text states. Some of the remaining spread does reflect a real methodological difference: Benson & Berry 2009 defines a megadrought using an explicit numeric threshold — Palmer Drought Severity Index at or below −1 for at least 60% of a dry period’s years, with at least two runs of three or more consecutive dry years — a formal criterion that the tree-ring chronology account in Cook et al. 2007 and the Palmer Drought Severity Index reconstruction in Benson et al. 2007 do not apply in the same way (Benson & Berry, 2009).
Causes and mechanisms
Southwest hydroclimate mechanisms operate on very different timescales, and the sources describing them cover correspondingly different windows of time. Over the full Holocene, orbital forcing is generally credited as the dominant early driver. A synthesis of North American Monsoon studies finds orbital insolation forcing dominant through the early-to-mid Holocene, peaking in importance around 6,000 years ago. The ENSO and the Pacific Decadal and Atlantic Multidecadal Oscillations became more important drivers of precipitation seasonality only after about 4,000 years ago (Metcalfe et al., 2015). A broader Holocene climate synthesis attributes part of this shift to an orbitally driven southward migration of the Northern Hemisphere summer Intertropical Convergence Zone. This migration weakened the African and Asian monsoons and “likely led to an increasing amplitude of the El Niño Southern Oscillation.” The same synthesis cautions against over-generalizing from any one period, however. Across the Holocene as a whole, solar irradiance minima, tropical volcanic eruptions, and periods of widespread cooling do not consistently coincide worldwide. The one clear exception it identifies is the Little Ice Age itself, roughly AD 1350 to 1850, when reduced summer insolation, solar activity minima, and several major tropical volcanic eruptions did coincide (Wanner et al., 2008).
Sediment records from Laguna Pallcacocha, in Ecuador (outside the Southwest, but used in this literature as a direct tropical Pacific ENSO proxy), trace the same long-term trend in more detail, though not without dispute. The foundational 12,000-year record finds El Niño-band variability becoming statistically significant around 7,000 years ago, increasing toward the present (with a roughly 2,000-year oscillation superimposed on the trend), peaking around 1,200 years ago, and then declining. It attributes this long-term trend to orbitally driven insolation change (Moy et al., 2002). A later re-analysis of the same sediment cores, using more sensitive geochemical methods, confirms this broad pattern back into the early Holocene (11,000 to 7,500 years ago). It also finds an unexplained drop in El Niño frequency 3,000 to 2,000 years ago, and proposes Atlantic Ocean and West African Monsoon teleconnections as an additional driver beyond orbital forcing alone (Mark et al., 2022). A separate research group disputes whether the Pallcacocha record tracks El Niño at all. Comparing sediment layers from two adjacent Ecuadorian lakes against 15 ENSO indices and decades of meteorological station data, it found no diagnostic link between intense local rainfall and El Niño phase specifically. Neither the strong 1982–83 nor 1997–98 El Niño produced the expected sediment layer. The group’s own late-Holocene flood-frequency trend across the 11th to 15th centuries also ran opposite to the original study’s. Its conclusion: “we suggest not to use the flood record preserved in Lake Pallcacocha to reconstruct El Niño events.” The 2022 re-analysis above, published after this critique, attributes the missing recent layers to nearby highway construction disturbing the site in 1994. The disputing study, however, had anticipated and argued against a disturbance explanation using a second lake as a control. The dispute remains unresolved (Schneider et al., 2018).
Independent of the Pallcacocha debate, a Southwest speleothem record spanning the full Holocene finds its own solar-forcing signal, with an unusual sign: periods of greater solar activity correlate with less Southwest moisture (R = −0.34 to −0.38 against a solar-activity proxy). This is the opposite sign from the same relationship in Asian-monsoon speleothem records. The Walker circulation is the east-west loop of rising and sinking air over the tropical Pacific whose strength governs whether conditions lean El Niño-like or La Niña-like. The proposed mechanism is solar modulation of this circulation: greater solar activity strengthens the Walker circulation and produces more La Niña-like conditions. The paper draws out the modern-relevance corollary directly: “increased warming due to other causes, such as increases in greenhouse gases, is likely to lead to even more arid conditions in the desert southwest.” (Asmerom et al., 2007). A related study by some of the same authors, focused on the Little Ice Age’s “Super Drought,” reports the opposite polarity at that later timescale: megadrought conditions there are associated with cool, not warm, Northern Hemisphere temperatures. The paper states plainly that this is “the opposite of the long-term (Holocene) relationship we previously described,” an inconsistency the authors themselves flag rather than one this article is introducing (Asmerom et al., 2013).
What drove the Medieval Climate Anomaly’s megadroughts is an actively debated question. The leading hypothesis centers on a persistent La Niña-like state in the tropical Pacific. Modeling driven by observed sea-surface temperatures from 1856 to 2000 reproduces the region’s major droughts and pluvials, including the Dust Bowl, with reasonable fidelity. In this framework, cool tropical Pacific sea-surface temperatures shift the subtropical jet streams poleward, suppressing precipitation simultaneously in the midlatitudes of both hemispheres, with a northward-shifted Intertropical Convergence Zone locally amplifying the effect over North America (Seager et al., 2005). Extending this mechanism across the last millennium using the drought reconstruction itself, a later analysis concludes that “the mechanism forcing persistent drought in the West and Plains in the current climate is synonymous with that underlying the megadroughts of the medieval period.” The two periods differ mainly in how long the La Niña-like state persisted: twenty to forty years during the Medieval Climate Anomaly, compared to single decades in 20th- and 21st-century droughts (Herweijer et al., 2007). A separate gridded reconstruction ties the AD 900–1300 dry epoch specifically to a modeled shift toward a cool, La Niña-like base state driven by “changing volcanic forcing and solar irradiance,” concentrated in a window of high solar irradiance and low volcanism around AD 1100 to 1250 (Cook et al., 2004).
That solar-and-volcanic-forcing explanation is directly disputed by a later review of the same evidence. General circulation models do simulate megadroughts. In this review’s own words, though, they “do not reproduce the temporal clustering of events during the [Medieval Climate Anomaly], suggesting they are not caused by the time history of volcanic or solar forcing.” In practice, the models’ megadroughts occur at different times than the ones actually reconstructed from tree rings. The same review instead treats internal variability in sea-surface temperatures, not the history of solar and volcanic forcing, as the primary driver. Land-surface and dust feedbacks contribute regionally (Cook et al., 2016). A subsequent modeling study using a paleoclimate data-assimilation product partly reconciles the two positions rather than resolving the dispute: frequent, cold La Niña-like sea-surface temperatures, together with warm Atlantic sea-surface temperatures, are found to explain up to 30% of decadal Southwest drought variability. That is more than twice the contribution attributed to Atlantic Ocean variability or radiative (solar and volcanic) forcing alone. By this account, these are real effects, but secondary and amplifying rather than primary (Steiger et al., 2019).
A specific physical mechanism linking solar activity to a La Niña-like state has been proposed, though it is not considered well understood even by the researchers proposing it. Elevated solar irradiance during the Medieval Climate Anomaly is modeled as driving a “dynamical thermostat” response that shifts the eastern tropical Pacific toward prolonged La Niña-like sea-surface temperatures. The paper introducing this mechanism for the region describes it as “not adequately understood.” (Cook et al., 2010). The same paper draws an explicit distinction that bears on how the Medieval Climate Anomaly’s megadroughts relate to 21st-century Southwest drying. The medieval droughts occurred “without any need for enhanced radiative forcing due to anthropogenic greenhouse gas forcing.” Future Southwest drying projected by climate models, by contrast, is driven by anthropogenic warming altering atmospheric circulation. The past and future droughts, the paper states, “may be comparable in the hydrological sense, but they have different causes.” (Cook et al., 2010)
Little Ice Age signature
The Little Ice Age is conventionally dated from about AD 1350 to 1850. The term itself has a Southwestern connection of a different kind. It originated from observations of Sierra Nevada glacier advances in western North America, only later broadened to encompass Europe and treated as a single global cold period. No such single period actually holds worldwide, per a multi-method review of global temperature reconstructions. The Little Ice Age’s coldest sustained interval falls in the 15th century across the central and eastern tropical Pacific, the 17th century in northwestern Europe and the southeastern United States, and the mid-19th century almost everywhere else (Neukom et al., 2019). This is part of why the Southwest’s own Little Ice Age signature, described below, is dated on its own regional evidence rather than assumed to align with the conventional global window.
Not every Southwest paleoclimate record shows the Little Ice Age as strongly as the Carlsbad Cavern speleothem record described above. A separate summer-temperature reconstruction finds the cooling “expressed only faintly” in its own record, limited to about two centuries of modestly cooler summers, roughly AD 1400 to 1500 (Gillreath-Brown et al., 2024). Its character in the north also differed from the Medieval Climate Anomaly’s. Rather than the La Niña-leaning state associated with medieval megadroughts, the Little Ice Age there is linked to cooler, wetter winters and increased El Niño frequency (Metcalfe et al., 2015).
A separate reconstruction reaches a similar conclusion to the Super Drought’s severity from a different angle. Of the megadroughts it rates as “highly probable” across an 800-to-1925 CE record, all occur before 1600, with better than 99% ensemble agreement (Steiger et al., 2019). This is broadly consistent with the Super Drought’s own 1350–1650 span, though framed as a probability threshold applied across many droughts rather than naming one continuous severe episode.
The same Guadalupe Mountains stalagmite record used earlier for the region’s deep-time climate history extends into this period too. It identifies a very dry, no-growth interval from roughly AD 1280 to 1490. This coincides with the abandonment of higher-elevation Pueblo IV-era dwellings and a broader population redistribution toward river valleys. This is a separate, independently documented abandonment from the Pueblo III-era “Great Drouth” abandonments described earlier. A brief, slightly wetter interval follows, roughly AD 1510 to 1660, which the study places explicitly “near the beginning of the Little Ice Age.” (Polyak & Asmerom, 2001)
Transition to the modern record
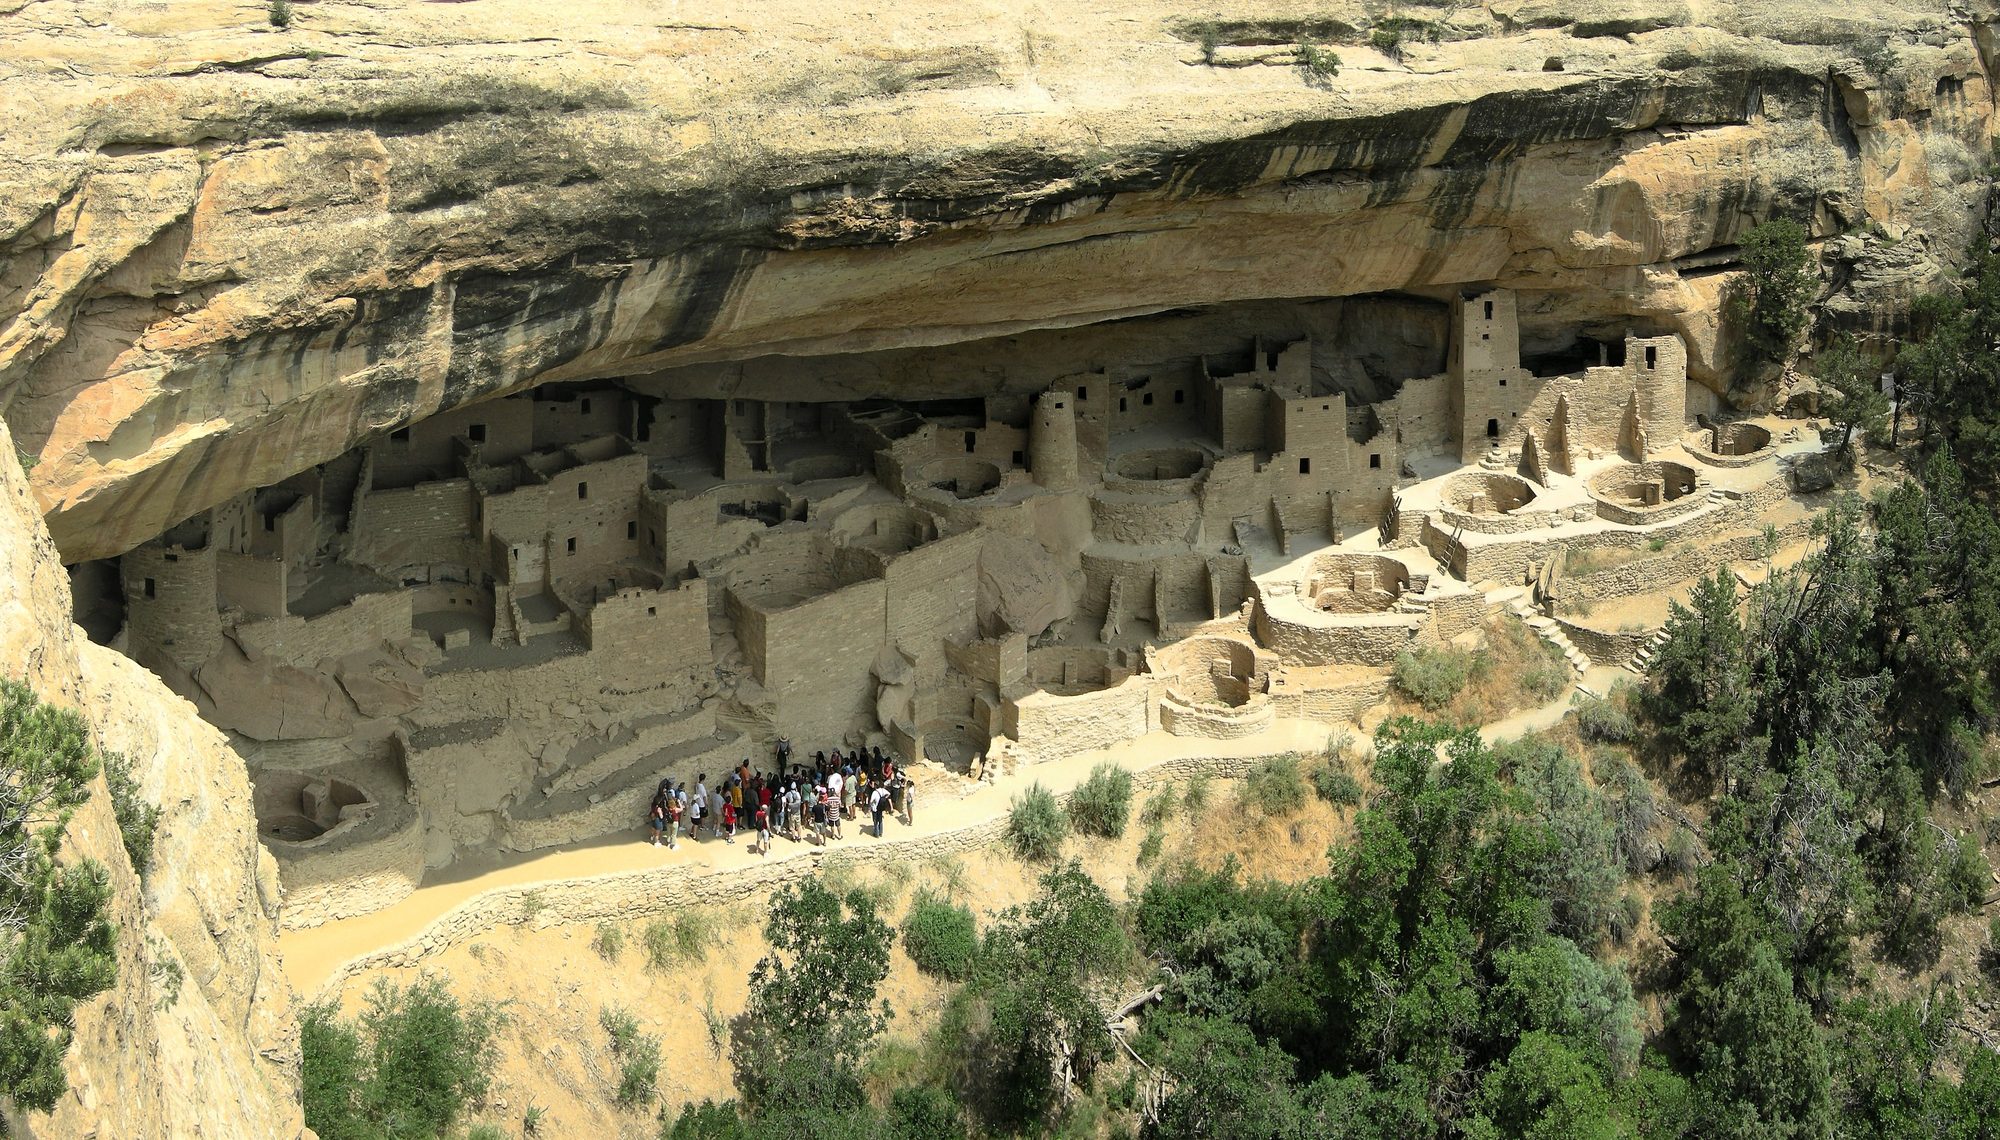
The shift away from the region’s medieval and Little Ice Age megadrought regime is dated, in broad terms, from about AD 1300 to 1920. One last severe drought interrupted the transition partway through, in the late 16th century.
A gridded reconstruction of the Palmer Drought Severity Index identifies a sharp shift toward less arid conditions beginning after AD 1300. This wetter regime persisted for roughly six centuries, until about 1920. The four lowest-aridity intervals in the entire record, including the early-20th-century pluvial, all fall within this six-century span (Cook et al., 2004). A later multi-region review reaches a similar conclusion using different data and methods. It finds “a long-term trend or shift toward wetter conditions around 1600 CE” across the Southwest, the Great Basin, and the Central Plains alike (Cook et al., 2016).
At least four independent studies date the interrupting late-16th-century drought. None of them agree on its exact span. Williams et al. 2020 dates it to AD 1575–1593. This is the most recent of only four Southwest megadroughts that paper’s soil-moisture reconstruction identifies since AD 800 (Williams et al., 2020). Fye et al. 2003 dates what appears to be the same event to AD 1570–1587, an 18-year drought it calls “the most severe sustained drought to impact North America in the past 500 to perhaps 1000 yr.” (Fye et al., 2003). A Colorado River drought-planning scenario dates it to AD 1579–1600. This scenario originates with a 1995 study. It remains in use in Colorado River water-management research today (Meko et al., 2022). The earliest identification predates all three. Dendrochronologist Edmund Schulman dated the drought to 1573–1593 in 1945, describing it as the Colorado River’s driest interval since AD 1300 (Meko et al., 2022). All four estimates describe an 18-to-22-year drought clustered within the same three decades.
Fye and colleagues connect this drought to documented catastrophe on both sides of what is now the US-Mexico border. Tree-ring-reconstructed precipitation for north-central Mexico shows its driest interval in centuries. This coincided with two epidemics of cocoliztli, a disease of undetermined identity. The epidemics struck in 1545–1548 and 1576–1578. The second killed an estimated two to 2.5 million people, about half of the native population that had survived the first epidemic (Acuna-Soto et al., 2002). The same drought is tied to documented abandonment and migration among Puebloan communities in New Mexico (Fye et al., 2003).
A 2022 study tested the 1579–1600 planning scenario against eight later Colorado River streamflow reconstructions. In five of the eight, that same 22-year window remained the period with the lowest average annual flow. Average flows ranged from 11.3 to 16.0 billion cubic meters, bracketing the original 1976 estimate of 13.6 (Meko et al., 2022). The two reconstructions extending into the medieval period found their own worst 22-year droughts elsewhere, in the 12th and 13th centuries. Even so, both had higher average flow than the late-16th-century window. By this specific measure, the late-16th-century drought remains the more severe event, despite the medieval droughts’ longer duration (Meko et al., 2022).
Modern era
The Southwest’s current megadrought is dated, in most reconstructions, from around 2000 to the present.
A 2022 study extending the region’s soil-moisture reconstruction through 2021 finds 2000–2021 to be the driest 22-year period in the Southwest since at least 800 CE. Its mean soil-moisture anomaly is 0.87 standard deviations below the 800–2021 average, edging out the previous record holder, 1571–1592, at 0.83 standard deviations below average (Williams et al., 2022). 2021 alone was nearly as dry as 2002, the driest single year in the 1901–2021 instrumental record, despite an active North American monsoon that year (Williams et al., 2022).
The same study estimates that anthropogenic climate change accounts for 42% of the 2000–2021 soil-moisture anomaly and 19% of the anomaly in 2021 alone. Without that contribution, it finds, 2000–2021 would not even qualify as a single extended drought event (Williams et al., 2022). Simulating how the drought might continue, the study gives it a 94% chance of lasting through a 23rd year and a 75% chance of reaching a 30th year. A 30-year drought would be the longest megadrought in the reconstructed record. Even without any further anthropogenic contribution, those odds only fall to 76% and 33% (Williams et al., 2022).
Model-based projections extend this trend forward. A study of future drought risk in the Southwest and Central Plains, reviewed in a 2016 assessment of megadrought research, finds greater than 80% likelihood of a megadrought in these regions between 2050 and 2099 under a high-emissions scenario. By most models and soil-moisture measures, it projects conditions in this period to be drier than “even the most arid, megadrought-prone centuries of the Medieval Climate Anomaly (1100–1300 CE).” (Cook et al., 2016).
The mechanism identified for the medieval megadroughts is not only a historical curiosity. Citing other research, a 2019 study notes evidence that cold tropical Pacific sea-surface temperatures, combined with local radiative forcing, may also explain the Southwest’s drying trend since the early 1980s (Steiger et al., 2019). This is a mechanistic claim, not just a comparison of severity. The same physical process linked to centuries-old droughts is proposed as an active driver of the present one.
Writing in 2004, before most of this modern-era evidence existed, one tree-ring-based reconstruction closed with a hypothesis of its own: “If elevated aridity in the western United States is a natural response to climate warming, then any trend toward warmer temperatures in the future could lead to a serious long-term increase in aridity over western North America.” (Cook et al., 2004). As with the medieval megadroughts described above, the present drought’s causes should not be assumed identical to the past’s just because their severity is comparable (Cook et al., 2010).
A different measure gives a more cautious picture. By reconstructed Colorado River streamflow rather than soil moisture, the 2000–2021 drought’s average flow remains about 1 to 1.25 billion cubic meters higher than the historical 1579–1600 benchmark and its worst-case rearrangement. By this specific measure, it has not yet exceeded that drought (Meko et al., 2022). The two findings are not contradictory. They measure different things, soil moisture against streamflow. Depending on which record is used, the same drought can look more or less severe.
Pluvials
Cook et al. 2025 catalog 38 extended pluvials and 39 extended droughts across the Southwest’s full 800-to-2023 CE tree-ring record, using the numeric definitions already given above (Cook et al., 2025). Three pluvials before 1900 are named individually in the record, alongside the two 20th-century pluvials already noted in Dating and duration.
Cook et al. 2025 attributes a mid-16th-century pluvial, dated 1549 to 1570, to Fye et al. 2003 (Cook et al., 2025). Fye et al. 2003’s own text describes something different. It dates a shorter, ten-year pluvial from 1549 to 1558, immediately followed by a separate megadrought beginning in 1570, the same late-16th-century event already discussed above (Fye et al., 2003). The two accounts of the same source disagree by twelve years on when the pluvial actually ended. Cook et al. 2025 also identifies a pluvial from 1594 to 1621, citing Robeson et al. 2020. It identifies another from 1825 to 1840, citing van der Schrier and Barkmeijer 2007 (Cook et al., 2025).
The two 20th-century pluvials carry a documented policy consequence. The earlier one, dated 1905 to 1923 by Cook et al. 2025, coincided with negotiation of the 1922 Colorado River Compact. The Compact allocated the river’s water among seven US states. Cook et al. 2025 states the connection directly: the pluvial’s high flow “would serve as the basis for the overly generous water allocations underpinning the Colorado River Compact of 1922… setting the stage for major conflicts across stakeholders in the region.” (Cook et al., 2025).
A National Research Council report gives the underlying numbers. The 1905-to-1922 negotiation period “contained the highest long-term annual flow volume in the 20th century, averaging 16.1 million acre-feet per year at Lees Ferry.” (National Research Council, 2007). The Compact’s framers assumed a mean annual flow of 16.4 million acre-feet at Yuma. Their gage records mostly began only in 1905, leaving out the drier years just before (National Research Council, 2007).
Fye et al. 2003 traces the same problem to its source. The Reclamation Service’s pre-Compact flow estimate was measured during this unusually wet pluvial, which the paper itself calls the “early twentieth-century pluvial.” (Fye et al., 2003). A later tree-ring reconstruction, cited in the same paper, found the true 400-year average flow to be only 13 million acre-feet per year, well below the amount assumed (Fye et al., 2003). That figure comes from Stockton’s single-author 1975 study. A related 1976 reconstruction by Stockton and Jacoby, used elsewhere in this article, gives a very similar but not identical figure, 13.5 million acre-feet per year (Fye et al., 2003; Meko et al., 2022).
A third source makes the same Compact point independently, citing the same 1986 study Fye et al. 2003 also relies on: “The Colorado River Compact that determined water allocations for the states of the Southwest was based on the anomalously large river flow in the first two decades of the twentieth century.” (Seager et al., 2005). This paper quotes Fye et al. 2003 as naming the pluvial the “early twentieth-century North American pluvial.” Fye et al. 2003’s own text uses a slightly different phrase, “early twentieth-century pluvial,” without “North American.” (Fye et al., 2003). The same paper coins its own term for a second wet interval, the “late-twentieth-century North American pluvial,” for the two decades of wetness that preceded its own writing, roughly the 1980s to 2000 (Seager et al., 2005).
A fourth source gives the clearest numeric comparison. Stockton and Jacoby’s 1976 reconstruction found the Colorado River’s average annual flow to be 16.65 billion cubic meters, or 13.5 million acre-feet (Meko et al., 2022). The 1922 Compact and the 1944 treaty with Mexico together allocated 20.35 billion cubic meters, or 16.5 million acre-feet, well above that reconstructed average. Stockton and Jacoby’s own assessment: “the timing of the drafting of the Compact was an unfortunate event, in that it did not occur during a representative flow period.” (Meko et al., 2022).
The pluvial’s own end date is itself disputed. Fye et al. 2003 dates it 1905 to 1917. The National Research Council frames it as the 1905-to-1922 negotiation period. Cook et al. 2025 dates it 1905 to 1923. All three sources cite the same 16.4-million-acre-foot flow assumption behind the Compact. The Compact narrative itself is therefore consistent across sources, even though the pluvial’s precise end year varies by as much as six years depending on which source is used (Fye et al., 2003; National Research Council, 2007; Cook et al., 2025).
One more pluvial-like interval predates this entire record: the multi-millennium wet phase described earlier in Before the Pueblo period, which preceded the onset of the region’s more arid, drought-and-pluvial-alternating regime around 740 CE (Polyak et al., 2022). It offers independent, non-tree-ring evidence that extended wet regimes recur throughout the Southwest’s climate history, well beyond the pluvials named above.
See also
- African humid period
- North American monsoon
- Paleoclimatology
- Southwestern North American megadrought
External links
- North American Drought Atlas (archived 12 September 2026) – interactive gridded tree-ring drought reconstructions (Tree-Ring Drought Atlas Portal), the underlying dataset behind several sources cited in this article
Sources
Acuna-Soto, Rodolfo; Stahle, David W.; Cleaveland, Malcolm K.; Therrell, Matthew D. (2002). “Megadrought and Megadeath in 16th Century Mexico.” Emerging Infectious Diseases, 8(4), 360–362. doi:10.3201/eid0804.010175
(2019). “Historic.” American Southwest Virtual Museum. https://swvirtualmuseum.nau.edu/wp/index.php/cult_land/archaeological-cultures/historic/ (accessed 1 September 2026; archived 12 September 2026 at https://web.archive.org/web/20260912191733/https://swvirtualmuseum.nau.edu/wp/index.php/cult_land/archaeological-cultures/historic/)
Asmerom, Yemane; Polyak, Victor; Burns, S.; Rasmussen, J. (2007). “Solar forcing of Holocene climate: new insights from a speleothem record, southwestern United States.” Geology, 35, 1–4. doi:10.1130/G22865A.1
Asmerom, Yemane; Polyak, Victor; Burns, S. J. (2010). “Variable winter moisture in the southwestern United States linked to rapid glacial climate shifts.” Nature Geoscience, 3, 114–117. doi:10.1038/NGEO754
Asmerom, Yemane; Polyak, Victor; Rasmussen, Jessica B.; Burns, Stephen J.; Lachniet, Matthew. (2013). “Multidecadal to multicentury scale collapses of Northern Hemisphere monsoons over the past millennium.” PNAS, 110, 9651–9656. doi:10.1073/pnas.1214870110
Benson, Larry V.; Berry, Michael S.; Jolie, Edward A.; Spangler, Jerry D.; Stahle, David W.; Hattori, Eugene M. (2007). “Possible Impacts of Early-11th-, Middle-12th-, and Late-13th-Century Droughts on Western Native Americans and the Mississippian Cahokians.” Quaternary Science Reviews, 26(3–4), 336–350.
Benson, Larry V.; Berry, Michael S. (2009). “Climate Change and Cultural Response in the Prehistoric American Southwest.” The Kiva, 75(1), 89–119. doi:10.1179/kiv.2009.75.1.005
Benson, Larry V.; Ramsey, Diane K.; Stahle, David W.; Petersen, Kenneth L. (2013). “Some Thoughts on the Factors That Controlled Prehistoric Maize Production in the American Southwest with Application to Southwestern Colorado.” Journal of Archaeological Science, 40(7), 2869–2880. doi:10.1016/j.jas.2013.03.013
Conroy, J. L.; Overpeck, J. T.; Cole, J. E.; Shanahan, T. M.; Steinitz-Kannan, M. (2008). “Holocene changes in eastern tropical Pacific climate inferred from a Galápagos lake sediment record.” Quaternary Science Reviews, 27(11–12), 1166–1180. doi:10.1016/j.quascirev.2008.02.015
Cook, Edward R.; Woodhouse, Connie A.; Eakin, C. Mark; Meko, David M.; Stahle, David W. (2004). “Long-Term Aridity Changes in the Western United States.” Science, 306(5698), 1015–1018. doi:10.1126/science.1102586
Cook, Edward R.; Seager, Richard; Cane, Mark A.; Stahle, David W. (2007). “North American drought: Reconstructions, causes, and consequences.” Earth-Science Reviews, 81(1–2), 93–134. doi:10.1016/j.earscirev.2006.12.002
Cook, Edward R.; Seager, Richard; Heim, Richard R. Jr.; Vose, Russell S.; Herweijer, Celine; Woodhouse, Connie. (2010). “Megadroughts in North America: Placing IPCC projections of hydroclimatic change in a long-term paleoclimate context.” Journal of Quaternary Science, 25(1), 48–61. doi:10.1002/jqs.1303
Cook, Benjamin I.; Ault, Toby R.; Smerdon, Jason E. (2016). “North American megadroughts in the Common Era: Reconstructions and simulations.” WIREs Climate Change, 7, 411–432. doi:10.1002/wcc.394
Cook, Benjamin I.; Smerdon, Jason E.; Cook, Edward R.; Williams, A. Park; Anchukaitis, Kevin J.; Mankin, Justin S. (2022). “Megadroughts in the Common Era and the Anthropocene.” Nature Reviews Earth & Environment, 3(11), 741–757. doi:10.1038/s43017-022-00329-1
Cook, Benjamin I.; Williams, A. Park; Smerdon, Jason E.; Marvel, Kate; Seager, Richard. (2025). “Megapluvials in Southwestern North America.” AGU Advances, 6, e2024AV001508. doi:10.1029/2024AV001508
Fye, Falko K.; Stahle, David W.; Cook, Edward R. (2003). “Paleoclimatic Analogs to Twentieth-Century Moisture Regimes Across the United States.” Bulletin of the American Meteorological Society, 84(7), 901–909. doi:10.1175/BAMS-84-7-901
Gillreath-Brown, Andrew; Bocinsky, R. Kyle; Kohler, Timothy A. (2024). “A low-frequency summer temperature reconstruction for the United States Southwest, 3000 BC–AD 2000.” The Holocene, 34(4), 451–466. doi:10.1177/09596836231219482
Gillreath-Brown, Andrew; Kohler, Timothy A. (2024). “How Maize Farmers in the US Southwest Grew and Prospered Under El Niño but Suffered Under La Niña.” KIVA: Journal of Southwestern Anthropology and History, 90(4), 455–479. doi:10.1080/00231940.2024.2348941
Herweijer, Cindy; Seager, Richard; Cook, Edward R.; Emile-Geay, Julien. (2007). “North American Droughts of the Last Millennium from a Gridded Network of Tree-Ring Data.” Journal of Climate, 20(7), 1353–1376. doi:10.1175/JCLI4042.1
Jiménez-Moreno, Gonzalo; Anderson, R. Scott; Shinker, Jacqueline J. (2021). “ENSO, sun and megadroughts in SW USA during the last 11,000 years.” Earth and Planetary Science Letters, 576, 117217. doi:10.1016/j.epsl.2021.117217
Mark, Sarah Z.; Abbott, Mark B.; Rodbell, Donald T.; Moy, Christopher M. (2022). “XRF analysis of Laguna Pallcacocha sediments yields new insights into Holocene El Niño development.” Earth and Planetary Science Letters, 593, 117657. doi:10.1016/j.epsl.2022.117657
Meko, David M.; Woodhouse, Connie A.; Baisan, Christopher A.; Knight, Troy; Lukas, Jeffrey J.; Hughes, Malcolm K.; Salzer, Matthew W. (2007). “Medieval drought in the upper Colorado River Basin.” Geophysical Research Letters, 34, L10705. doi:10.1029/2007GL029988
Meko, David M.; Woodhouse, Connie A.; Winitsky, Annabel G. (2022). “Tree-ring perspectives on the Colorado River: Looking back and moving forward.” Journal of the American Water Resources Association, 58, 604–621. doi:10.1111/1752-1688.12989
(n.d.). “Correct Usage Of ‘Drought’ or ‘Drouth’.” Merriam-Webster. https://www.merriam-webster.com/wordplay/drought-or-drouth (accessed 3 September 2026; archived 12 September 2026 at https://web.archive.org/web/20260912191925/https://www.merriam-webster.com/wordplay/drought-or-drouth)
Metcalfe, Sarah E.; Barron, John A.; Davies, Sarah J. (2015). “The Holocene history of the North American Monsoon: ‘known knowns’ and ‘known unknowns’ in understanding its spatial and temporal complexity.” Quaternary Science Reviews, 120, 1–27. doi:10.1016/j.quascirev.2015.04.004
Moy, Christopher M.; Seltzer, Geoffrey O.; Rodbell, Donald T.; Anderson, David M. (2002). “Variability of El Niño/Southern Oscillation activity at millennial timescales during the Holocene epoch.” Nature, 420, 162–165. doi:10.1038/nature01194
(10 December 2014). “Prehistoric Cultures.” Science of the American Southwest. https://www.nps.gov/subjects/swscience/prehistoric-cultures.htm (accessed 1 September 2026; archived 12 September 2026 at https://web.archive.org/web/20260912191826/https://www.nps.gov/subjects/swscience/prehistoric-cultures.htm)
National Research Council. (2007). “Colorado River Basin Water Management: Evaluating and Adjusting to Hydroclimatic Variability.” Washington, DC: National Academies Press. doi:10.17226/11857
Neukom, Raphael; Steiger, Nathan; Gómez-Navarro, Juan José; Wang, Jianghao; Werner, Johannes P. (2019). “No evidence for globally coherent warm and cold periods over the preindustrial Common Era.” Nature, 571(7766), 550–554. doi:10.1038/s41586-019-1401-2
Onac, Bogdan P.; Baumann, S. M.; Parmenter, D. S.; Weaver, E.; Sava, T. B. (2020). “Late Holocene droughts and cave ice harvesting by Ancestral Puebloans.” Scientific Reports, 10, 20131. doi:10.1038/s41598-020-76988-1
Overpeck, J. T.; Webb, T., III; Prentice, I. C. (1985). “Quantitative Interpretation of Fossil Pollen Spectra: Dissimilarity Coefficients and the Method of Modern Analogs.” Quaternary Research, 23(1), 87–108. doi:10.1016/0033-5894(85)90074-2
Polyak, Victor J.; Asmerom, Yemane. (2001). “Late Holocene climate and cultural changes in the southwestern United States.” Science, 294(5540), 148–151. doi:10.1126/science.1062771
Polyak, Victor J.; Asmerom, Yemane; Lachniet, Matthew S. (2022). “Climatic backdrop for Pueblo cultural development in the southwestern United States.” Scientific Reports, 12. doi:10.1038/s41598-022-12220-6
Polyak, Victor J.; Olivarez, H. C.; Rojas Vilches, F. S.; Calabrò, L.; Giovannetti-Nazario, D. A.; Lachniet, Matthew S.; Asmerom, Yemane. (2025). “The Southwestern United States Altithermal Interval (9.5–7 ka): Longest dry period of the Holocene.” Quaternary Science Reviews, 367, 109533. doi:10.1016/j.quascirev.2025.109533
Schneider, Tobias; Hampel, Henrietta; Mosquera, Pablo V.; Tylmann, Wojciech; Grosjean, Martin. (2018). “Paleo-ENSO revisited: Ecuadorian Lake Pallcacocha does not reveal a conclusive El Niño signal.” Global and Planetary Change, 168, 54–66. doi:10.1016/j.gloplacha.2018.06.004
Seager, Richard; Kushnir, Yochanan; Herweijer, Celine; Naik, Naomi; Velez, Julien. (2005). “Modeling of Tropical Forcing of Persistent Droughts and Pluvials over Western North America: 1856–2000.” Journal of Climate, 18, 4065–4088. doi:10.1175/JCLI3522.1
Steiger, Nathan J.; Smerdon, Jason E.; Cook, Benjamin I.; Seager, Richard; Williams, A. Park; Cook, Edward R. (2019). “Oceanic and radiative forcing of medieval megadroughts in the American Southwest.” Science Advances, 5, eaax0087. doi:10.1126/sciadv.aax0087
Viau, A. E.; Ladd, M.; Gajewski, K. (2012). “The climate of North America during the past 2000 years reconstructed from pollen data.” Global and Planetary Change, 84–85, 75–83. doi:10.1016/j.gloplacha.2011.09.010
Wanner, Heinz; Beer, Jürg; Bütikofer, Jacqueline; Crowley, Thomas J. (2008). “Mid- to Late Holocene climate change: an overview.” Quaternary Science Reviews, 27(19–20), 1791–1828. doi:10.1016/j.quascirev.2008.06.013
Williams, A. Park; Cook, Edward R.; Smerdon, Jason E.; Cook, Benjamin I.; Abatzoglou, John T. (2020). “Large contribution from anthropogenic warming to an emerging North American megadrought.” Science, 368(6488), 314–318. doi:10.1126/science.aaz9600
Williams, A. Park; Cook, Benjamin I.; Smerdon, Jason E. (2022). “Rapid intensification of the emerging southwestern North American megadrought in 2020–2021.” Nature Climate Change, 12(3), 232–234. doi:10.1038/s41558-022-01290-z
Woodhouse, Connie A.; Meko, David M.; MacDonald, Glen M.; Stahle, David W.; Cook, Edward R. (2010). “A 1,200-year perspective of 21st century drought in southwestern North America.” PNAS, 107(50), 21283–21288. doi:10.1073/pnas.0911197107
Note on sourcing
This entry is original work, researched and written directly from the primary and secondary scientific literature listed in Sources.