
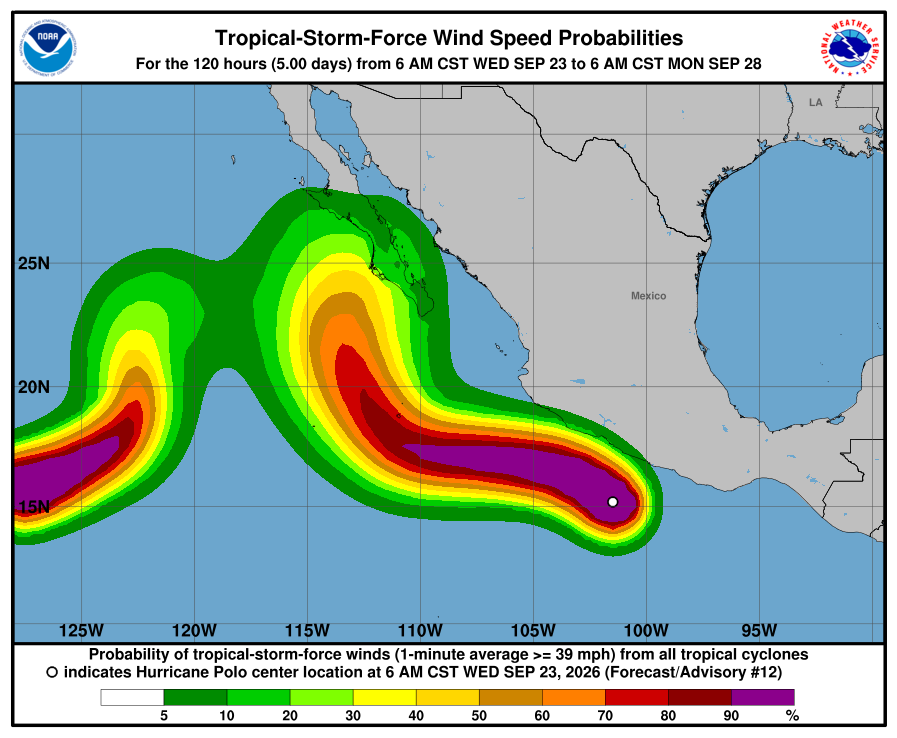
Hurricane Polo blew up into a Category 5 storm off Mexico’s Pacific coast this week, and the remnant moisture from that system is the setup for Arizona heading into next Monday through Wednesday. Most of the national coverage on it is cautious, pointing at New Mexico as the bigger flood risk right now and saying it is still too early to know exactly what track Polo takes or how much of that moisture actually reaches us. My own model tracker backs that caution up, and it does it in a specific way. The four models this site tracks are not agreeing yet.
Polo’s own track is a good example of how much this can move. Guidance earlier this week had its core running close along Mexico’s coast, close enough to call it a near miss. The latest guidance keeps that core offshore instead, sliding west without making that close pass. That is a real shift in the forecast for a storm that hit Category 5 earlier this week and has since eased to a Category 4. It is still getting watched by every model out there, and the Hurricane Center’s own discussion says its strength could keep swinging. So it should not be a surprise that four models looking a week out at what is left of Polo, after it crosses into Arizona, are not lined up yet either.
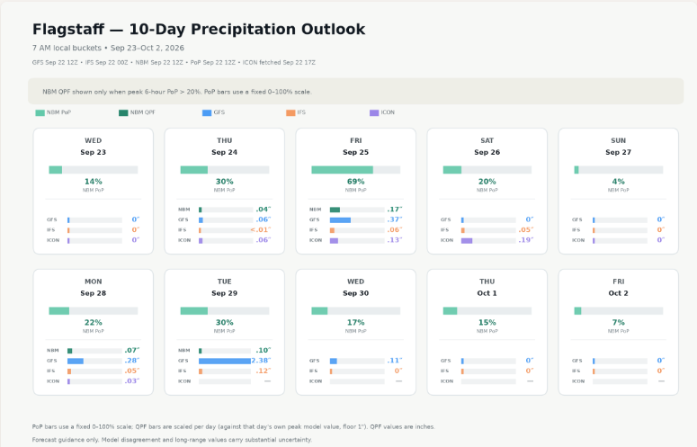
Start with Anthem. Monday looks quiet across the board, 19% chance of measurable rain, with GFS and ICON both sitting at zero and IFS barely showing 0.02 inches. Tuesday is where it gets interesting. GFS jumps to 1.24 inches, IFS holds at just 0.04 inches, and ICON is not showing a number for that day at all. Wednesday backs off again. GFS drops to 0.01 inches, IFS is at zero, and ICON still is not showing anything.
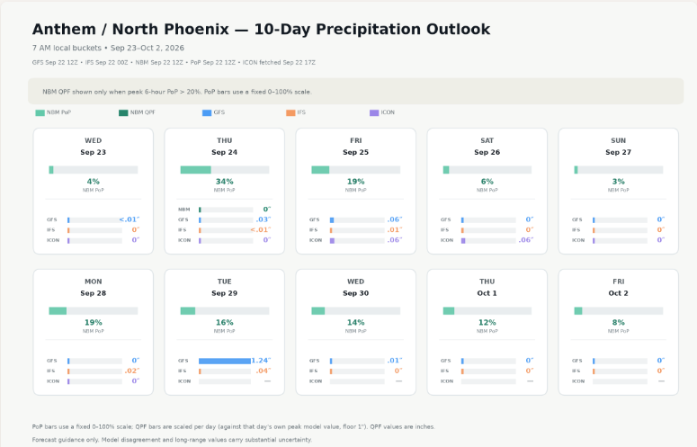
Flagstaff tells the same story, bigger. Monday is calm, a 22% chance of rain with GFS, IFS, and ICON landing close together at 0.28, 0.05, and 0.03 inches, the one day these three models actually agree on a small number. Then Tuesday hits, and GFS jumps to 2.38 inches. That’s not a typo. It’s the single highest number anywhere in this site’s whole 10-day window. IFS barely blinks at 0.12 inches, and ICON does not show a number for that day at all. Wow, what a swing. Wednesday backs off again, GFS down to 0.11, IFS at zero, ICON still blank.
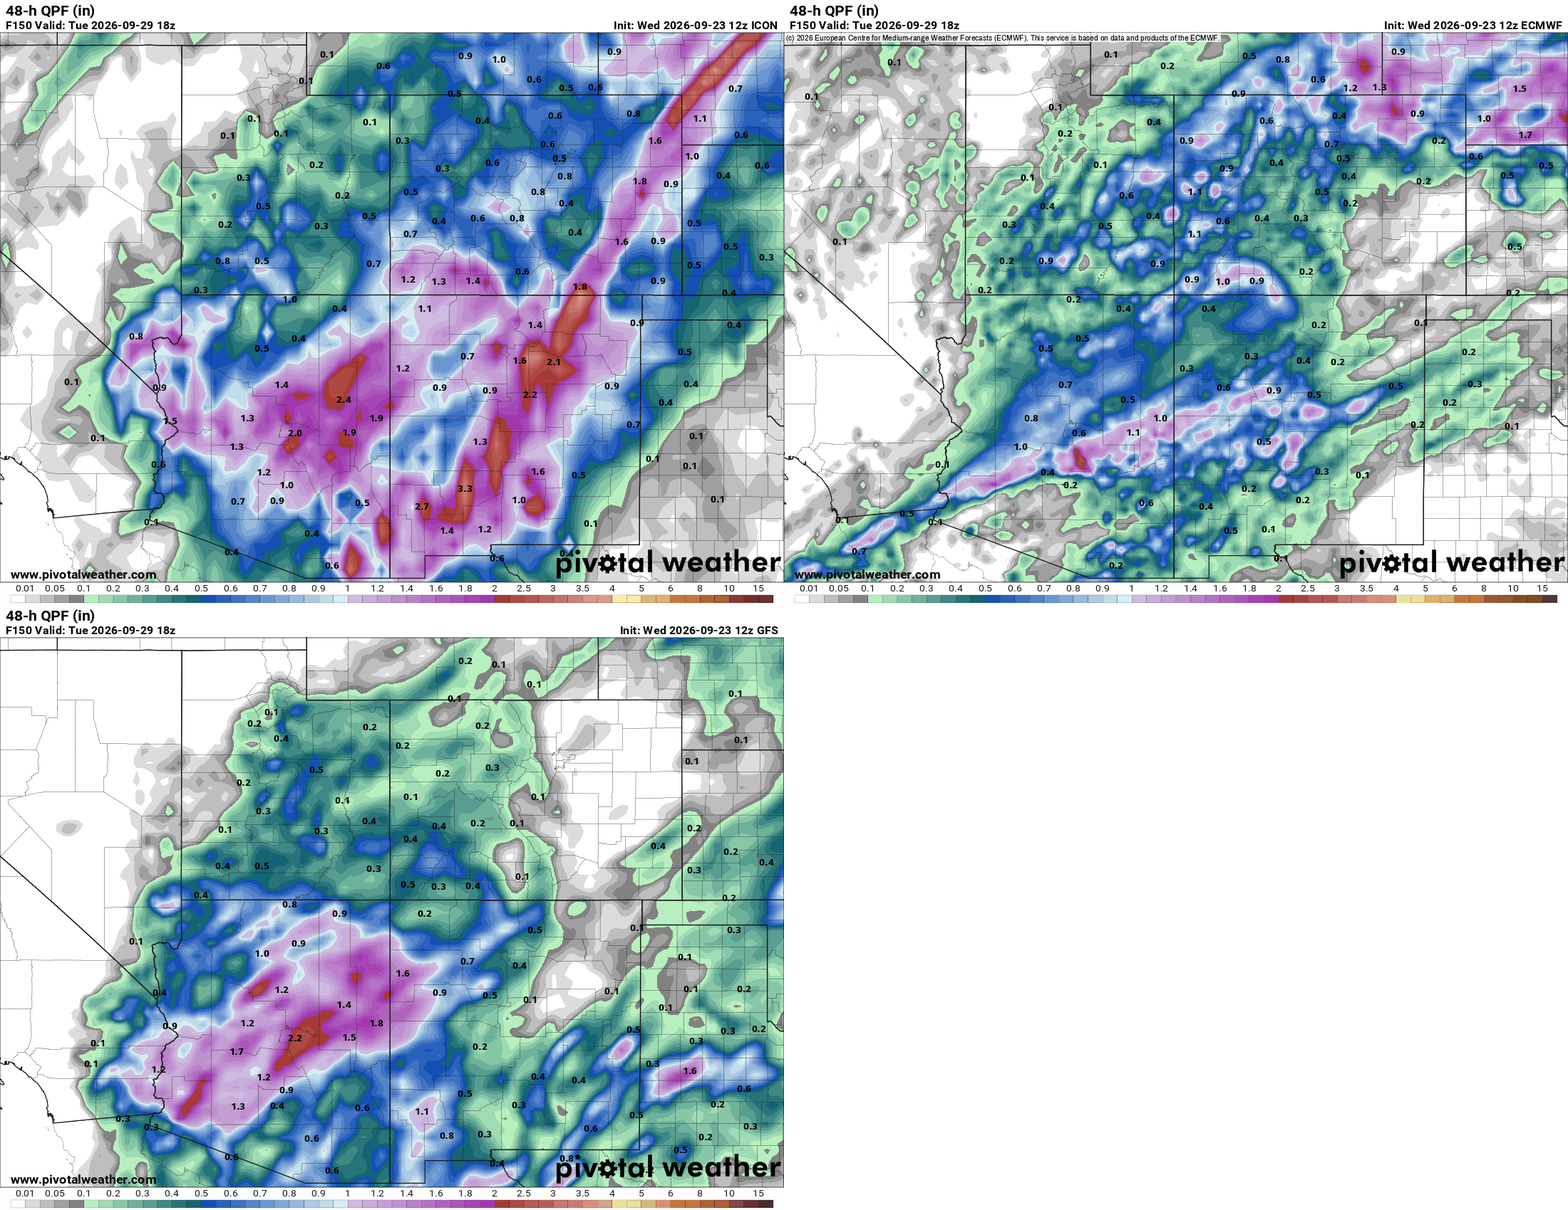
That model spread looks different by this afternoon. Comparing ICON, ECMWF, and GFS from the same run, all three now put a corridor of heavier rain across central Arizona, with peaks between 1.7 and 2.4 inches along roughly the same stretch. That’s real convergence compared to where these models stood a day ago, though ECMWF is still running lighter than the other two. It’s still six days out, so treat the shape of it as a likely pattern, not a locked-in forecast.
These two charts make the same point a different way. They track what each model has said about that Sept 27-29 window, the 48 hours ending Tuesday at noon UTC, run after run since September 19th. IFS spiked to 1.65 inches for Anthem and 1.90 for Flagstaff on one run, then came almost all the way back down by the next one. GFS did the same thing in reverse, jumping to 1.24 inches for Anthem and 2.66 for Flagstaff on its Tuesday morning run, then dropping fast. ICON only shows up starting September 22nd, its own forecast range is too short to reach this far out from any earlier run, and even in that short window its first two runs swung from 0.17 to 0.64 inches at Anthem.
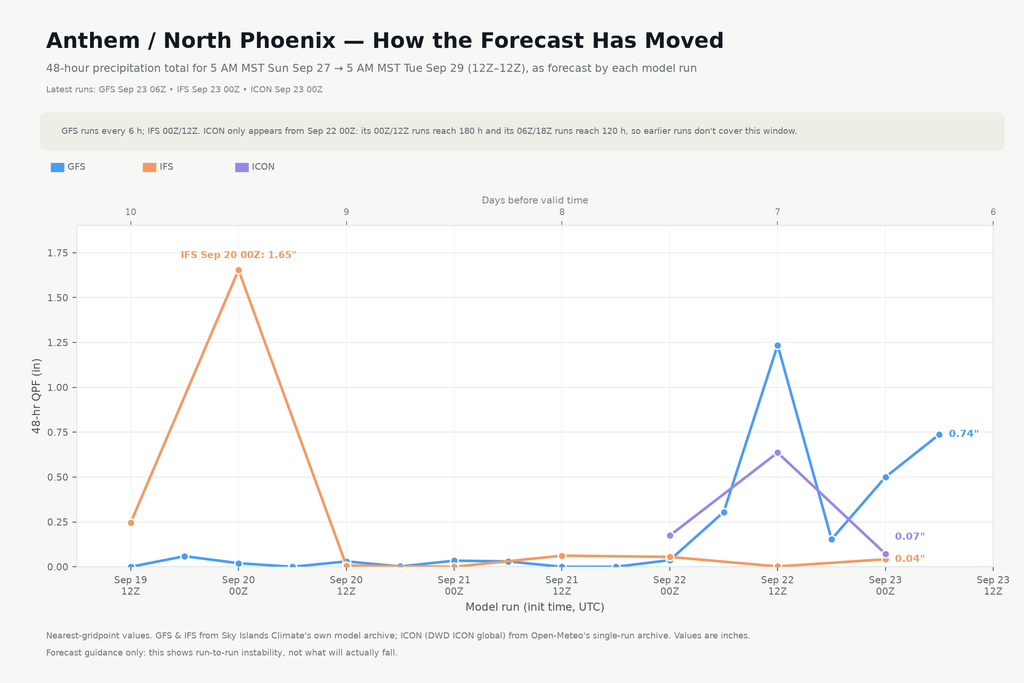
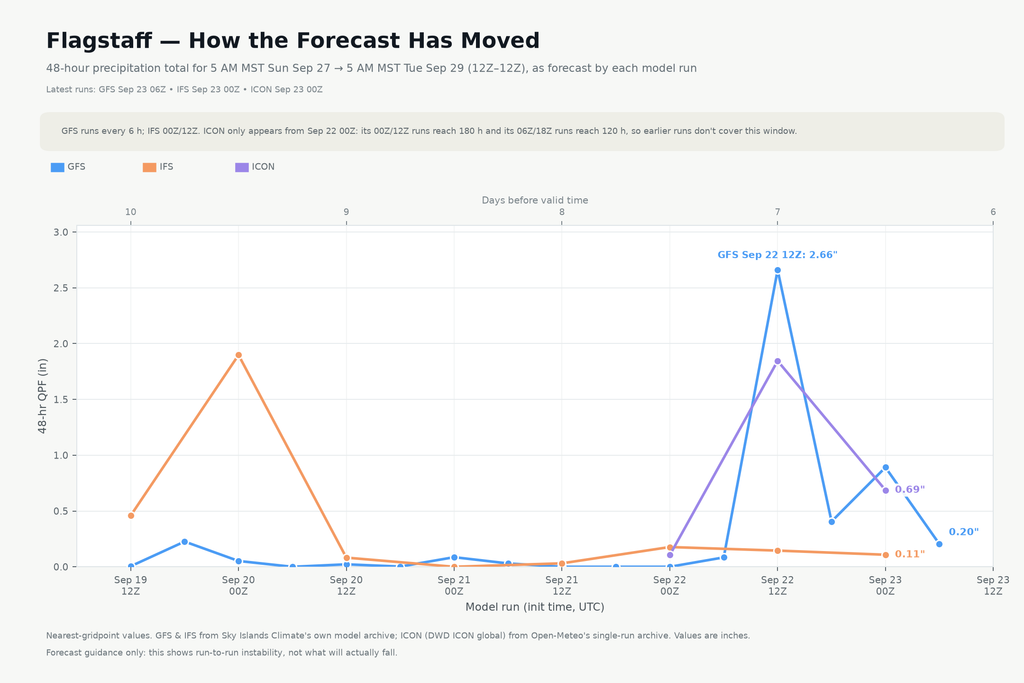
So one model is seeing something the other two are not, and it is happening on the same day at both locations. That is not a knock on GFS. It just means we are looking at a moisture plume six and seven days out, right in the range where these models tend to fall apart from each other.
None of this means Tuesday is a washout for Flagstaff or a dry bust for Anthem. It means the picture is not settled, and it will not be settled until we are inside two or three days instead of six. Worth watching, not worth planning around yet.