
NZI is a seasonal climate index built from sea-surface temperature and atmospheric-pressure anomalies near New Zealand. It’s used to forecast winter precipitation in the southwestern United States (SWUS) months in advance. A statistical link like this is called a teleconnection: conditions in one distant part of the world reliably foreshadow weather in another. The NZI was proposed in 2018 by a research team led from the University of California – Irvine. It showed stronger predictive skill than traditional ENSO-based indices over 1982–2015, though its statistical robustness and physical mechanism have since been challenged, and defended, in the peer-reviewed literature.
Definition
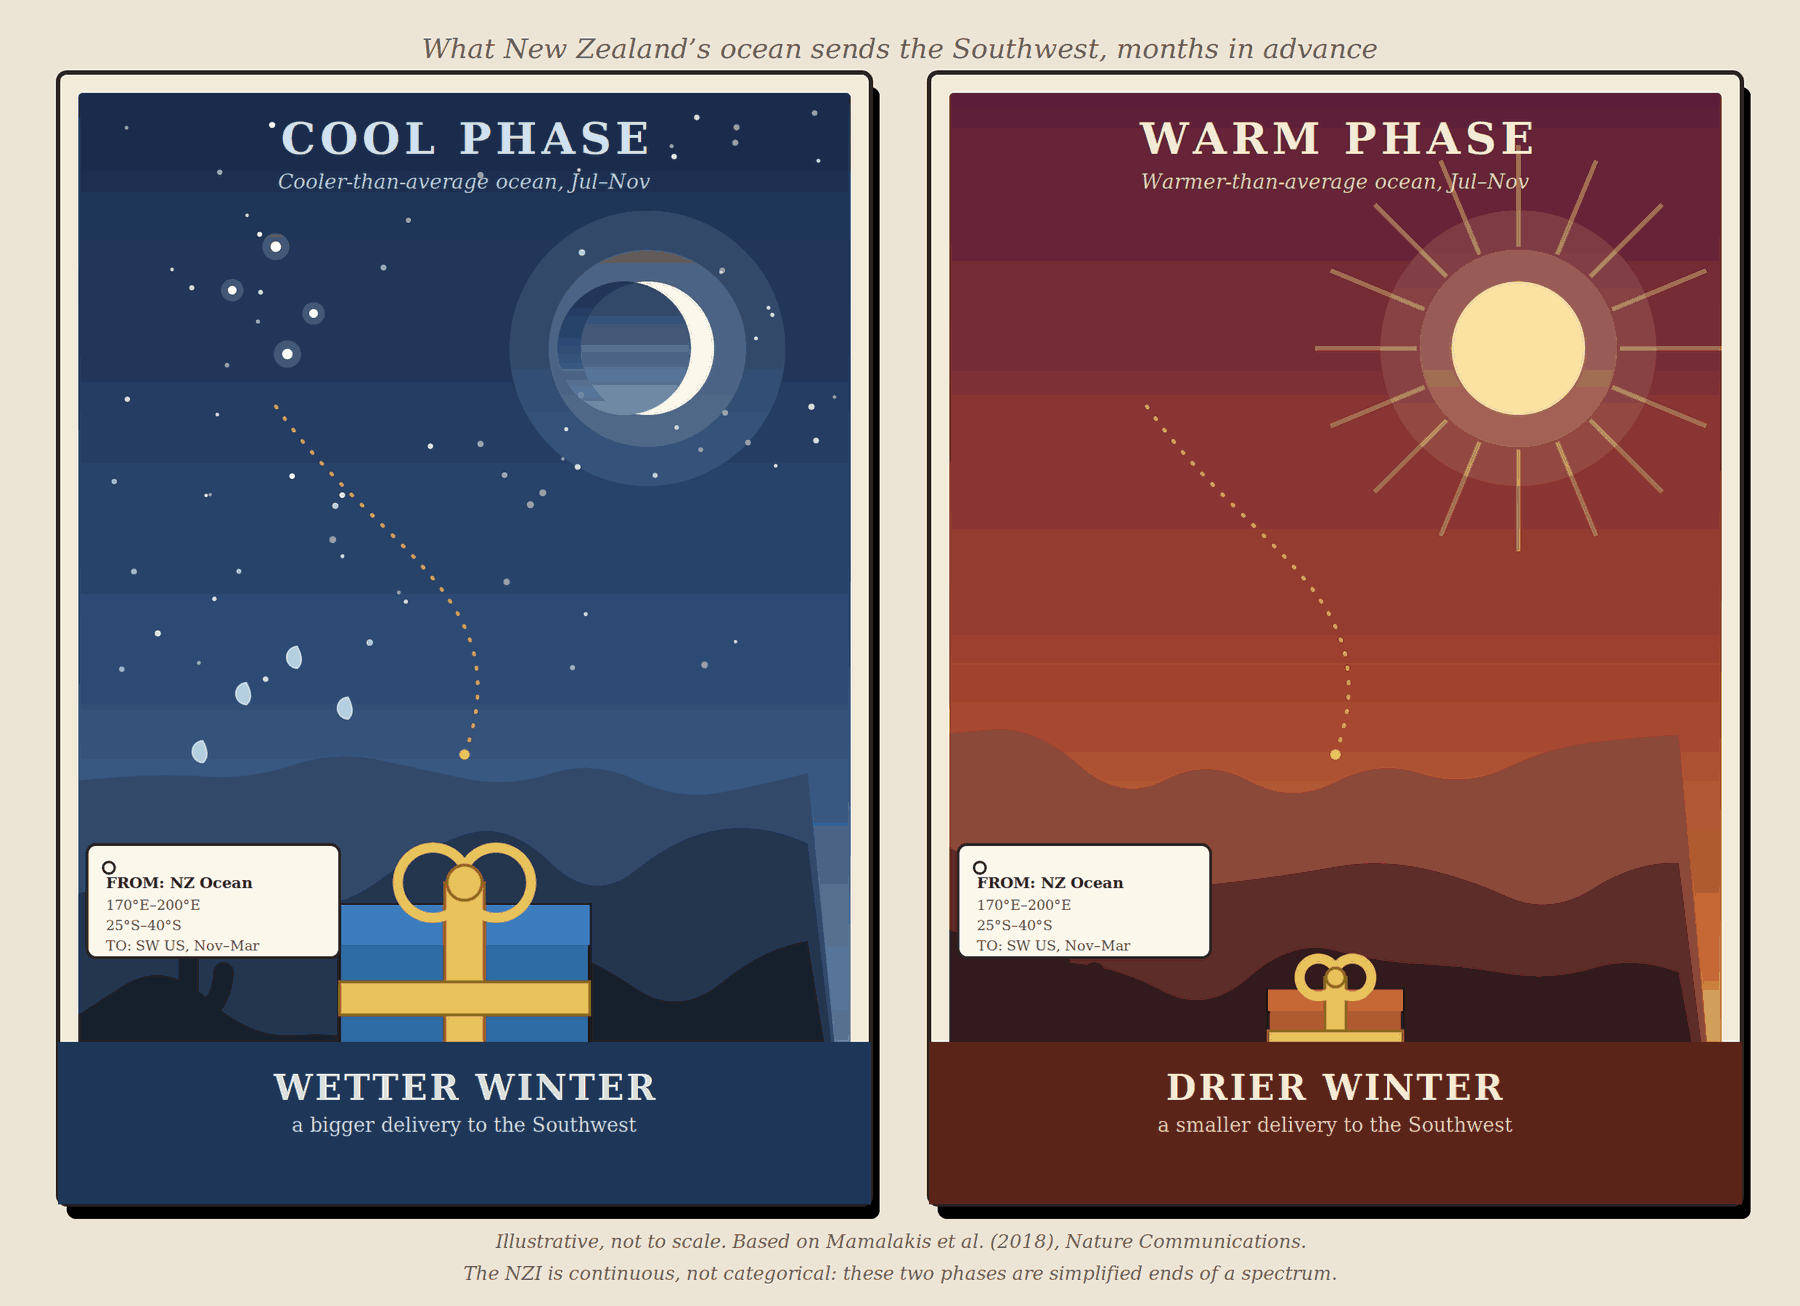
In plain terms: Picture a relay race that starts in the open ocean northeast of New Zealand in late summer. It finishes four months later as either rain or drought in Arizona and California. If the water in that stretch of the Pacific is running cool when the race starts, a chain of knock-on effects in the atmosphere tends to hand off a wetter winter to the Southwest. If it’s running warm, the chain tends to hand off a drier one. The New Zealand Index is simply a number that captures how warm or cool that patch of ocean and the air above it are running. That way forecasters can read the baton as it’s passed, months before winter actually arrives.
In formal terms: The NZI is defined from sea-surface temperature (SST) and 400-hPa geopotential-height anomalies averaged over a 30° × 15° box of open ocean northeast of New Zealand (170°E–200°E, 25°S–40°S). A geopotential-height anomaly is a way of expressing how much higher or lower the atmosphere stands at a given pressure level than its long-term average. In effect, it’s pressure variability translated into a height departure. The index is computed over two lead windows ahead of the SWUS winter wet season (November–March): July–September, giving roughly a 3-month lead, and September–November, giving roughly a 1-month lead. The relationship is negative: warm NZI anomalies correspond to drier SWUS winters, and cool NZI anomalies correspond to wetter ones. Unlike ENSO, the NZI has no official “neutral” category or warm/cool threshold. It’s a continuous value, and every year falls somewhere on that scale. “Warm” and “cool” are descriptive labels for the two ends of that scale, not membership in a defined phase. El Niño, La Niña, and Neutral are defined that way for the Niño 3.4 index, but the NZI has no equivalent set of categories.
How the Teleconnection Works
The proposed mechanism linking New Zealand’s ocean to Arizona’s rain gauges runs in three stages:
- An atmospheric bridge (late summer). The Hadley circulation is the large overturning loop of air that rises near the equator and sinks back down in the subtropics of each hemisphere. During Northern Hemisphere summer, this circulation expands across the equator, temporarily linking the two hemispheres’ atmospheres more directly than usual. During this window, SST anomalies near New Zealand become strongly correlated with SST anomalies far to the north, in the western Pacific east of the Philippines. That correlation has run around 0.7–0.8 in recent decades.
- Maintenance (fall). Local air-sea coupling is feedback between the ocean surface and the atmosphere directly above it, where each reinforces the other. This coupling keeps those western Pacific SST and pressure anomalies locked in place through the three-to-four-month gap between the NZI’s measurement and the following winter.
- Jet-stream modulation (winter). The subtropical jet is a fast-moving ribbon of upper-level winds that steers winter storm systems. The western Pacific anomaly alters atmospheric pressure over the eastern Pacific and western US. It does this by setting off a short-wave train: a chain of alternating high- and low-pressure ridges and troughs. It carries an atmospheric disturbance downstream from one region to another, much like ripples spreading across a pond. A cool NZI intensifies the subtropical jet near 30–35°N, steering more moisture and storm systems into the Southwest. A warm NZI deflects the jet northward, leaving the Southwest dry while the Pacific Northwest tends to run wetter. That’s a seesaw, or dipole, pattern along the West Coast.
Predictive Strength and Changes Over Time
Over the 1982–2015 period, NZI correlations with SWUS winter precipitation reached roughly −0.55 using the July–September lead, and about −0.7 using the September–November lead. That’s notably stronger than the 0.3–0.5 correlations typical of Niño 3.4, the standard ENSO index, over the same period. The relationship is not static, however. During 1950–1983, the link between New Zealand-area SSTs and the western Pacific anomalies that drive the mechanism was weak, with correlations below 0.45. It only strengthened markedly after the early 1980s. This strengthening has coincided with a decline in ENSO’s own predictive power for SWUS winter precipitation in recent decades. That’s part of why the NZI drew attention as a potential complement, or alternative, to ENSO-based outlooks.
Relationship to ENSO
NZI and ENSO are not mutually exclusive predictors. The original authors found that NZI’s correlation with SWUS precipitation held up even after statistically controlling for ENSO. That means it appears to carry forecast information that Niño 3.4 does not. In recent decades, ENSO’s own relationship with SWUS winter precipitation has weakened while the NZI relationship has strengthened. That makes NZI a candidate for use alongside ENSO, rather than as a straight replacement for it.
An Ongoing Scientific Debate
Unlike El Niño and La Niña, which are well-established and uncontroversial, the NZI is a young and actively debated finding. In 2019, Gibson, Waliser, and DeFlorio published a critical examination of the NZI. They argued that non-stationarity (the relationship changing over time), natural climate memory, and overlap with other known modes of variability could make correlations like NZI’s appear by chance alone. They illustrated this point using climate model simulations, and they also questioned whether the proposed physical mechanism held up under independent satellite and reanalysis data.
Mamalakis and co-authors replied the same year. They argued that the NZI signal survived statistical controls for ENSO and local sea-surface temperature persistence. They also found that it strengthened in step with reduced variability across an ensemble of climate model runs, which they argue points to a real, forced response rather than noise. And they showed that independent reanalysis composites still matched their proposed Hadley-circulation mechanism.
As of this writing, the NZI is best treated as a promising but still-contested seasonal predictor, not settled operational guidance. It’s one input worth watching alongside ENSO and other indices, not a standalone forecast tool.
Relevance to the Sky Islands
Winter precipitation in Arizona’s sky island ranges comes almost entirely from Pacific frontal systems riding the subtropical and polar jets, not from the summer monsoon. The NZI’s July–November measurement window leads the region’s November–March wet season by one to several months. Because of that lead time, a reliable version of this signal could eventually give water managers and snowpack forecasters in the sky islands a useful outlook tool. That tool wouldn’t depend on ENSO being in a strong, readable phase. That would be especially useful in “ENSO-neutral” years, which otherwise offer forecasters little to go on. Given the index’s contested standing in the literature, it is best treated today as a research signal to watch. It isn’t yet a basis for operational seasonal outlooks.
See Also
- El Niño–Southern Oscillation (ENSO) / Niño 3.4 Index
- Pacific–North American (PNA) pattern
- Subtropical jet stream
- Hadley circulation
Sources
- Mamalakis, A., Yu, J.-Y., Randerson, J.T., AghaKouchak, A., & Foufoula-Georgiou, E. (2018). A new interhemispheric teleconnection increases predictability of winter precipitation in southwestern US. Nature Communications, 9, 2332.
- Gibson, P.B., Waliser, D.E., & DeFlorio, M.J. (2019). A critical examination of a newly proposed interhemispheric teleconnection to Southwestern US winter precipitation. Nature Communications, 10, 2822.
- Mamalakis, A., Yu, J.-Y., Randerson, J.T., AghaKouchak, A., & Foufoula-Georgiou, E. (2019). Reply to: A critical examination of a newly proposed interhemispheric teleconnection to Southwestern US winter precipitation. Nature Communications, 10, 2823.
- UC Irvine News: To Forecast Winter Rainfall in the Southwest, Look to New Zealand in the Summer