
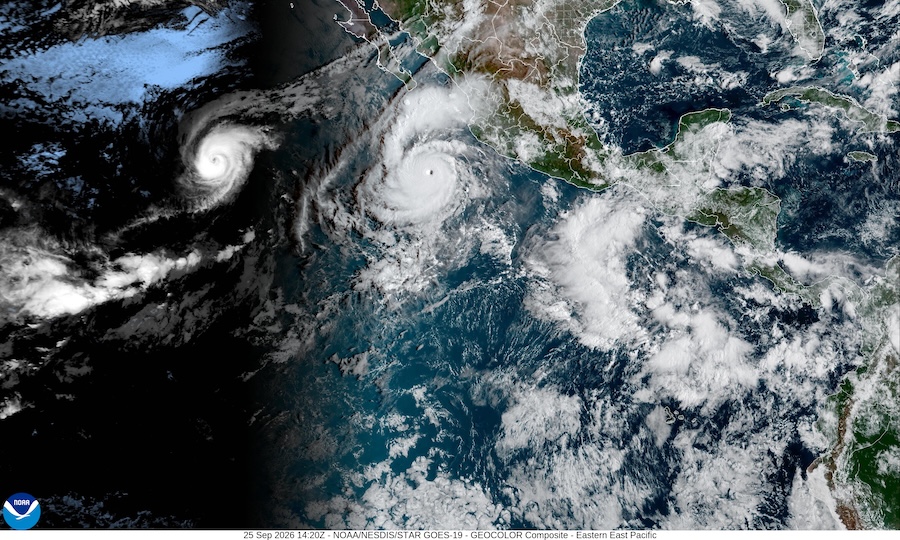
Hurricane Polo keeps changing the game on us. It hit Category 5 last week, eased back to a Category 4, and as of this morning’s advisory it is a Category 5 again. The remnant moisture headed for Arizona is tied to all of that, and the models still can’t agree on how much of it lands here or when. So we’re picking this story back up with a cleaner approach this time: a fixed target window instead of chasing whatever window the models happen to be excited about that week.
A few of you spotted something in the satellite loop worth asking about: two well-defined hurricanes, Polo and Odalys, close enough together to wonder about the Fujiwhara effect, where two storms start orbiting each other. It turns out my own line about hurricanes influencing weather a thousand miles out isn’t far off the real number. According to the Hong Kong Observatory, storms typically start affecting each other right around 870 miles apart, with the rotation visibly speeding up inside 400 miles and actual merging under 190. Polo and Odalys were around 1,090 miles apart this morning, just outside that first threshold, but NHC’s own forecast has them closing to somewhere around 600 miles by this weekend, and the Hurricane Center’s own discussion on Odalys already names Polo as a reason its track forecast is getting hazier, with “considerable increasing model guidance spread.” So it isn’t happening yet, but it’s close, and the forecasters are already wrestling with exactly what that reader spotted.
Here’s the timing problem underneath all of this. The last post on Polo tracked a 48-hour window ending around Tuesday evening, and that target kept sliding later as Polo’s moisture arrival shifted. This time we picked one fixed window and are tracking every run against it instead: the 60 hours from Monday at midnight UTC to Wednesday at noon UTC, September 28 through 30. That’s 5 PM Sunday to 5 AM Wednesday, Arizona time.
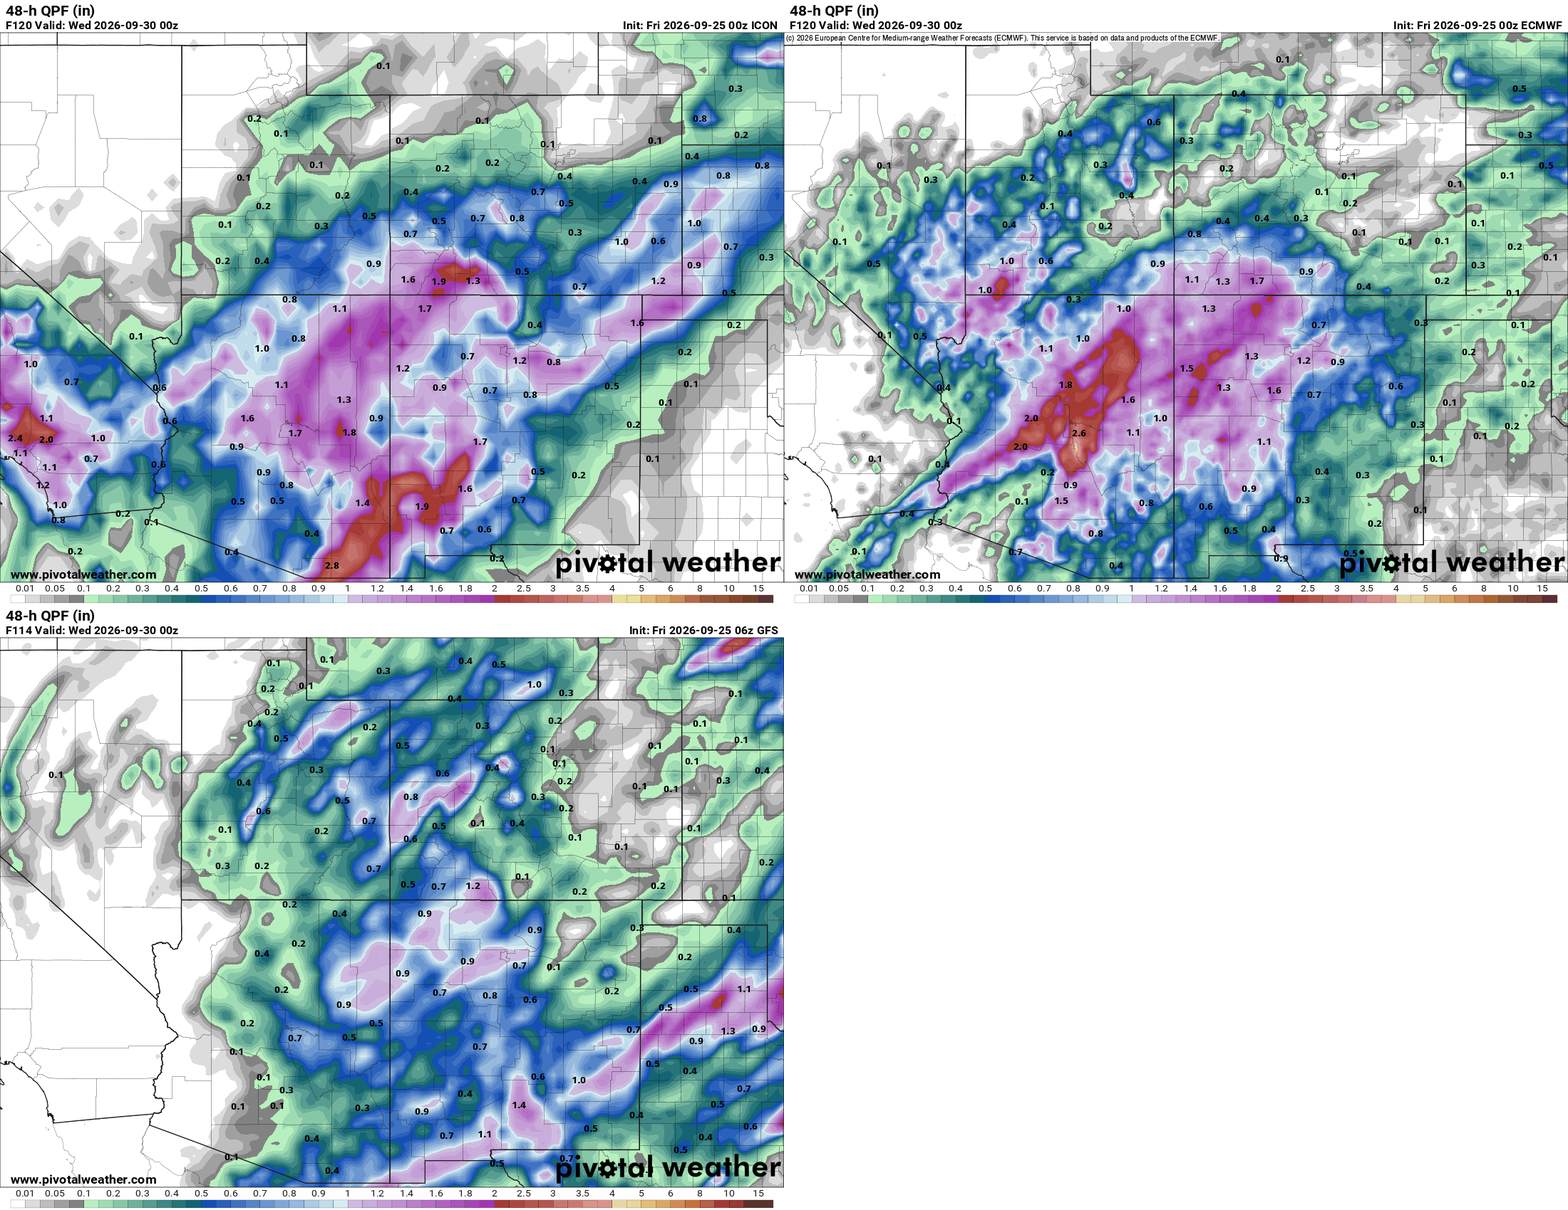
This morning’s models still don’t agree on the shape of it. Comparing ICON, ECMWF, and GFS from the same general timeframe, ICON is running considerably wetter across central Arizona into New Mexico, with isolated totals over 2.5 inches. ECMWF is in between, with its own strong pocket in south-central Arizona up near 2.6 inches. GFS is the outlier on the dry side, mostly under an inch statewide. Three models, three different stories, same 48 hours.
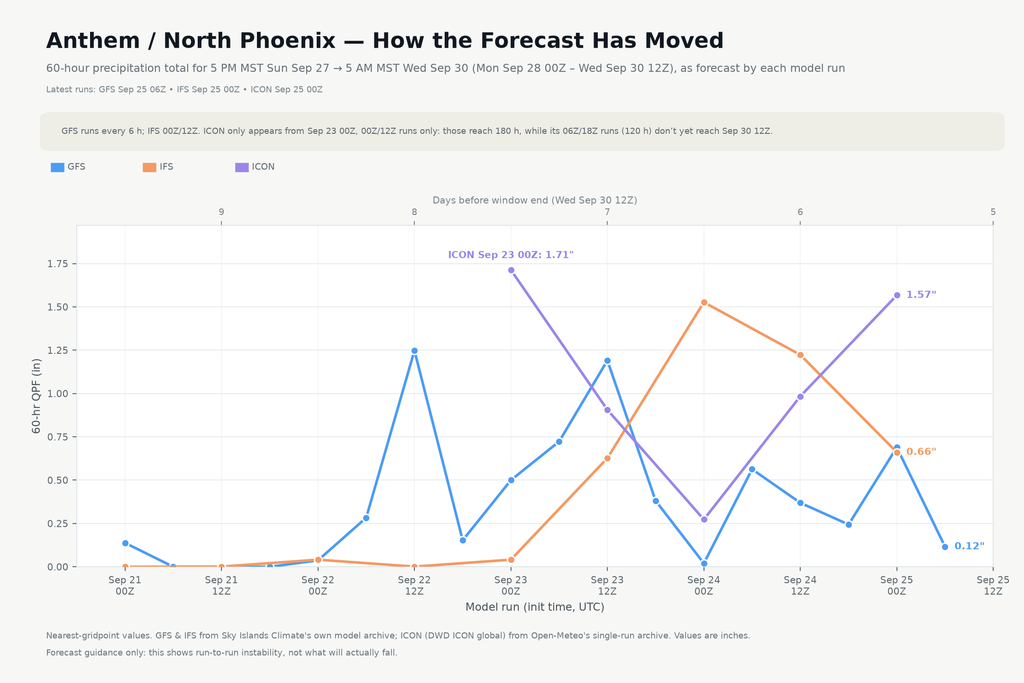
Anthem’s chart tells a real reversal story. Back on September 23rd, ICON spiked to 1.71 inches for this window, the high point of the whole run history. GFS had its own peak a day earlier, 1.25 inches on the Sep 22 afternoon run, then spent the next two days sliding toward zero. On the newest runs, ICON is still the wettest at 1.57 inches, IFS has come up to 0.66 inches, and GFS has dropped all the way down to 0.12. The model that led the charge a few days ago is now the driest one in the group.
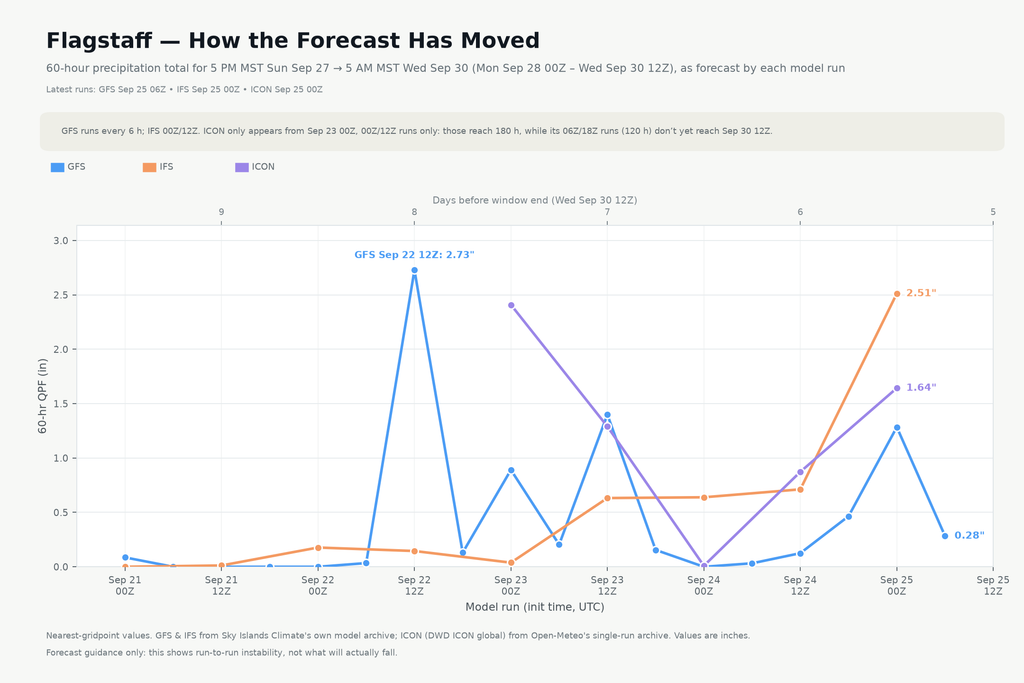
Flagstaff’s version is even more dramatic. GFS spiked to 2.73 inches on that same Sep 22 afternoon run, the single highest number in this whole history at either location. It fell hard after that. IFS, which had barely registered anything most of the week, jumped to 2.51 inches on the newest run, essentially swapping places with GFS. ICON sits in between at 1.64 inches. Over four days, the roles of the wet model and the dry model have completely traded places.
So the models keep calling Marco, and Polo keeps answering from somewhere else. None of them are doing anything wrong. Ask three different physics engines to nail down a moisture plume six days out, while the storm feeding that plume can’t even decide if it’s a Category 4 or a Category 5, and this is what you get. Keep watching, not planning around it yet, same as before, just with a fixed target this time instead of a moving one. Hurricanes are still difficult to predict.