
Rachel’s long gone, but her leftover moisture kept raining on us for the better part of a week. Here’s where things landed across my network. Then the part that actually matters: how weird this is for October, going back to 1950 at KFLG.
The wrap-up
Flagstaff got hammered. KFLG sat at 0.00″ for the first eight days of the month. Then Rachel’s fallout moved in and didn’t let up.
- Oct 9: 0.26″
- Oct 10: 0.16″
- Oct 11: 1.98″
- Oct 12: 0.88″
- Oct 13: 0.27″
That’s 3.55″ in five days, straight from the NWS Flagstaff climate reports. Already more than double this October’s entire normal (1.52″, 1991-2020), with over half the month still to go.
Anthem, way down at the bottom of the elevation gradient from Flagstaff, saw a lot less. My Anthem 2.8 E station (CoCoRaHS AZ-MR-661) picked up 0.83″ for the month, almost all of it between the 10th and 14th. Normal there runs 0.73″ (NOAA) to 0.86″ (PRISM). So Anthem basically landed right on its average October. No drama down there.
Now, the part that matters: how unusual is this?
That’s really the question. Not “how much rain fell,” but “how much rain, for October, here.”
KFLG’s answer: pretty unusual. Through Oct 13, the station sits at 0.62″ above its normal-to-date, running a departure of +2.93″. We’ve already blown past the whole month’s normal with more than half the month left to go.
Zoom out past October and the story holds. Since January 1st, KFLG sits at 16.72″, a bit above the 16.17″ normal, and ahead of where it was at this point last year (14.69″). This isn’t just a wet week bolted onto a dry year. The whole year’s running a touch wet too.
I pulled KFLG’s complete October precipitation record from NOAA to see exactly where this ranks. Two histograms below. One back to 1950, one back to 1898, as far as the station’s record goes.
October precipitation at KFLG, 1950-present
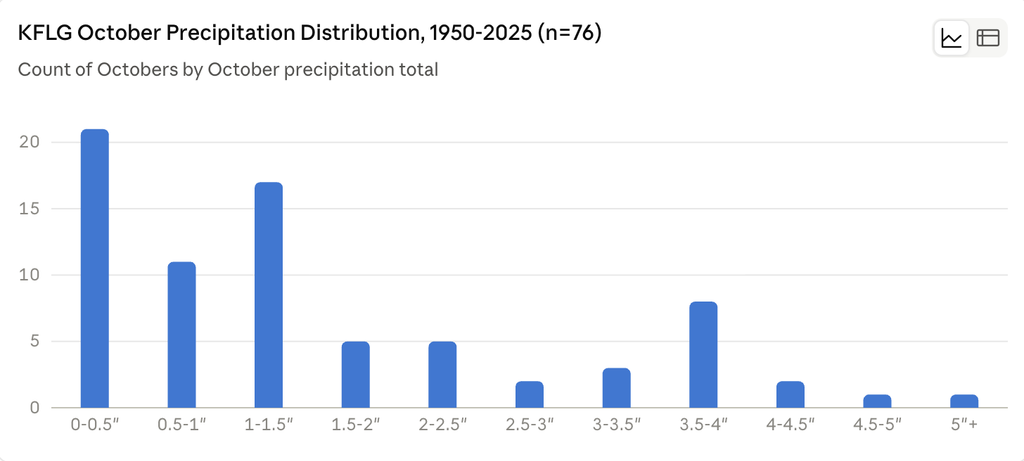
Since 1950, 11 Octobers out of 76 beat 3.55″. That puts 2026 at roughly the 12th-wettest October at KFLG since 1950. Only a handful are clearly ahead of us: 1972 (9.86″), 1987 (4.64″), 1971 (4.37″), 2018 (4.21″), and 2000 (3.85″).
October precipitation at KFLG, 1898-present
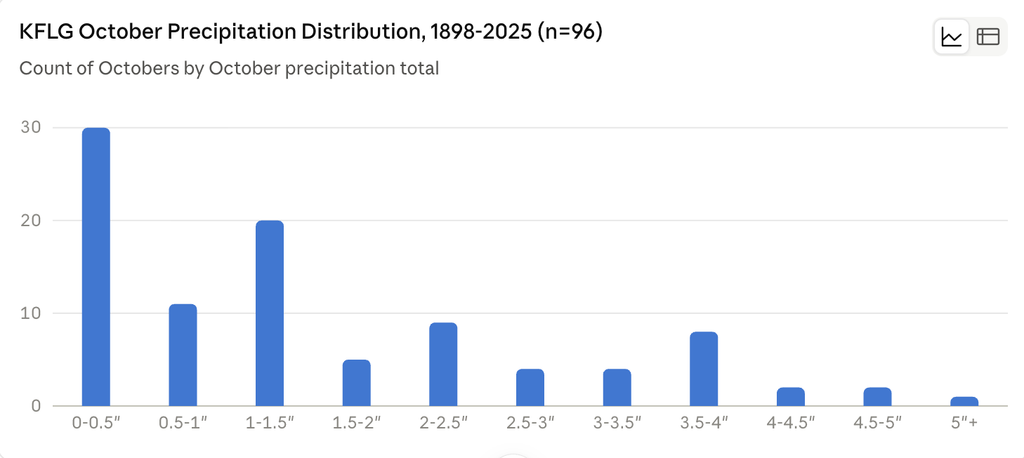
Go back to 1898 and it’s a similar story. 12 of the 96 years with data beat this total, putting 2026 around 13th-wettest since the station’s record began. The two wettest Octobers on record, 1972 (9.86″) and 1941 (4.91″), are both well clear of us. So are 1899 (4.89″) and 1907 (4.58″), both documented in NOAA’s own technical memo on the years before the digital record starts (WR-273), not in the plotted dataset above.
Either way you slice it, Rachel’s fallout put Flagstaff in roughly the top 15% of its own October history. That’s not a record. But it’s not “just a wet week,” either.
Sources: NWS Flagstaff (WFO FGZ) CLIFLG/CF6FLG climate reports, through Oct 13, 2026. NOAA/NCEI Climate at a Glance City Time Series for KFLG (station USW00003103), 1898-2025. CoCoRaHS station AZ-MR-661 (Anthem 2.8 E). 1899 and 1907 October totals from NOAA Technical Memorandum WR-273.