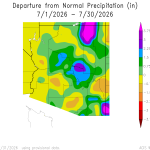
With El Niño being aggressively hyped, along with heavy rainfall predictions, it’s a good idea to look at what actually happened. And, possibly more importantly, what do we really know about our weather in Arizona.
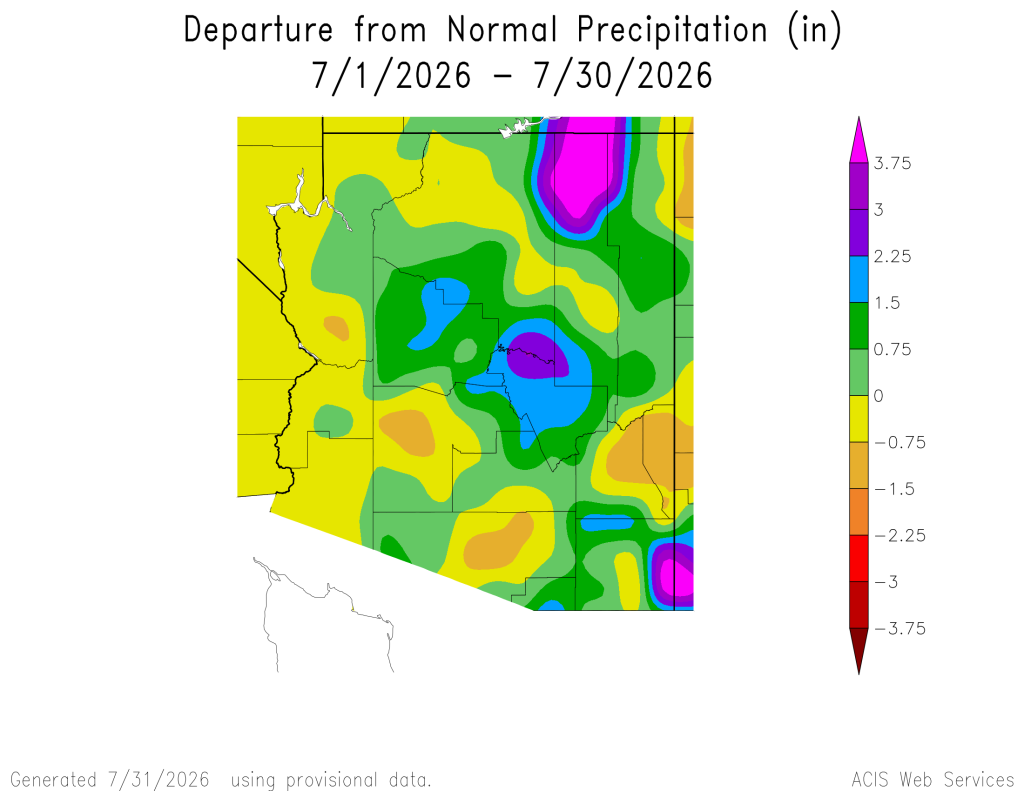
There it is. Wetter than normal in some places. Drier than normal in others. This data is based on weather stations across Arizona. And, with Arizona having many sparsely populated areas, there are some gaps.
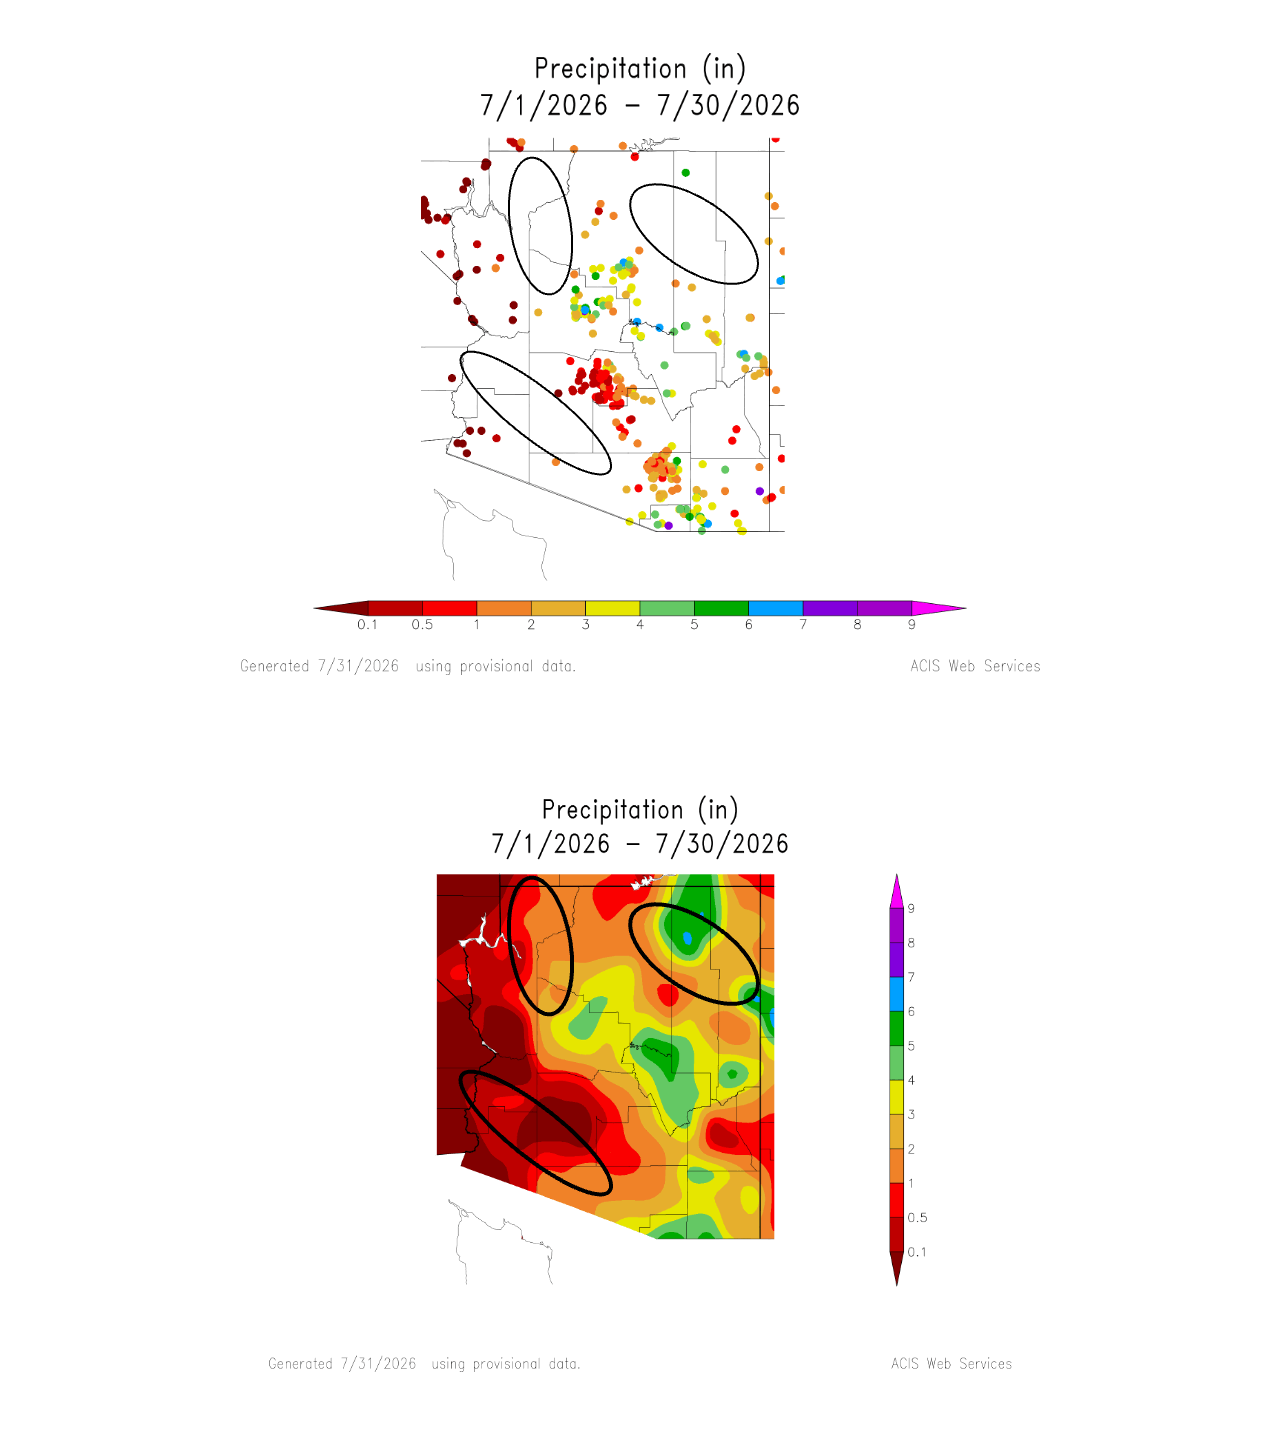
Notice how the shaded areas are interpolated over regions that have no stations. I have highlighted 3 such areas. One area in northwestern Arizona is shown as close to average, although there are no stations. One in northeastern Arizona is shown as wetter to much wetter than average. One in the southwest is very dry. In the northeast, it appears a single station is extrapolated to a broad area. So, how would one know?
You could check CoCoRaHS.org. They have mapping tools that can be used to zoom into Arizona. Still, they don’t fill in the gaps.
To me, it looks like a fairly average monsoon month for Arizona. If you live in an area without coverage, I encourage you to buy a CoCoRaHS.org compatible rain gauge and participate in the monitoring. They are easy to find via their website.
As we progress into the later part of summer and early fall, hopefully we will see more rain. El Niño can be finicky. It is not a sure driver for more moisture during monsoon season. For fun, checkout my Seasonal Outlook Tool. It’s up to date through June. July numbers will be available soon.