

Here is where we stand as of September 2026. PDO is negative, -1.55. AMO is positive, +1.25. Niño 3.4 is +2.08, officially El Niño territory, and still climbing. The Niño 1+2 region, off the coast of Peru and Ecuador, is reading +3.94°C warm. That’s a loud signal. Wait…what am I talking about?
We are talking about ocean temperatures that have effects on Arizona’s weather. So I ran the analogous years, month by month for the same PDO, AMO and ENSO combination, across 76 years of Flagstaff’s precipitation record. The outputs are in a chart below. Only four years match. That’s not a lot, and it may matter.
First up is October. 75% chance above normal. 0% below. 25% near normal. The analog median is 2.07 inches, against a 76-year median of 1.13. That’s nearly double the norm. Good. October may be wetter than average.
Then there is November. 25% below, 50% near normal, 25% above. The analog median is 1.37 inches, just a touch above the 76-year median of 1.29. Call it a toss up.
Then December breaks the pattern. 75% below normal, 0% above. The analog median is 0.47 inches, against a norm of 1.19. Out of four months, this is the only one leaning dry. Hmmm. This isn’t looking like the big, wet El Niño winter we have been promised.
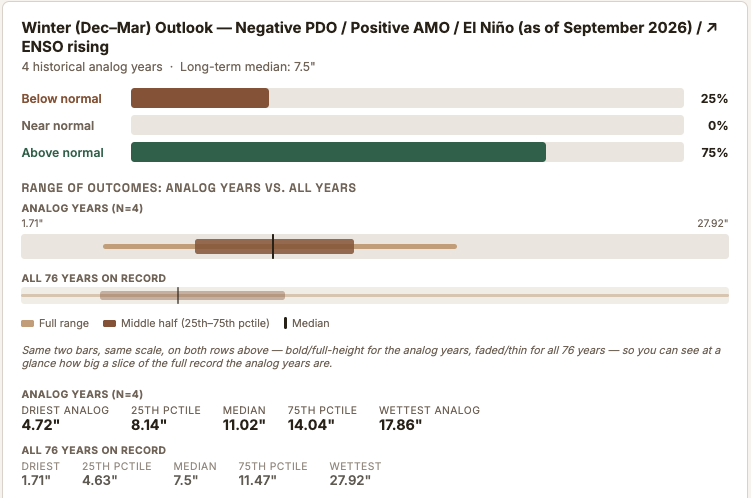
The winter total, December through March, is where the possibility for a wet winter becomes evident. January, February and March end up pulling in higher likelihoods of above average precipitation. 75% above normal, an analog median of 11.02 inches against a 76-year median of 7.5.
Here’s what that looks like laid out across all six months:
Flagstaff Seasonal Outlook · Analog Years
Precipitation outlook, month by month: Oct 2026–Mar 2027
Conditions as of September 2026: PDO −1.55 (negative), AMO +1.25 (positive), Niño 3.4 +2.08 (El Niño, still climbing). Four historical analog years match this combination. Each month below shows the full range, the middle 50%, and the median of those 4 analog years against the same spread for all 76–77 years on record.
⚠ Only 4 analog years inform each month. Treat the probabilities as a rough signal, not a calibrated forecast — see individual years at the source link below.
| Month | Series | Driest | 25th pctile | Median | 75th pctile | Wettest |
|---|
So the real shape of this winter, at least by the analogs, isn’t a slow building start. It’s wet, then neutral, then a sharp dip in December, then wet again, hard enough to pull the whole season back above normal. If December only contributes half an inch, and the whole season adds up to 11, that leaves something like 10 inches for January through March. That’s rough napkin math, not exact, since medians don’t stack cleanly across different year-groupings. Worth noticing that the wettest analog was not even close to the wettest on record.
There are only 4 analog years out of 76, just over 5%. Not a huge signal. It’s what we have. I’m waiting for one more data point that might give us a bit more direction. More on that when it comes in.
For now: wet October, quiet November, a real dry notch in December, and a winter that still needs a strong January through March to pencil out. We’ll see how it actually plays out.