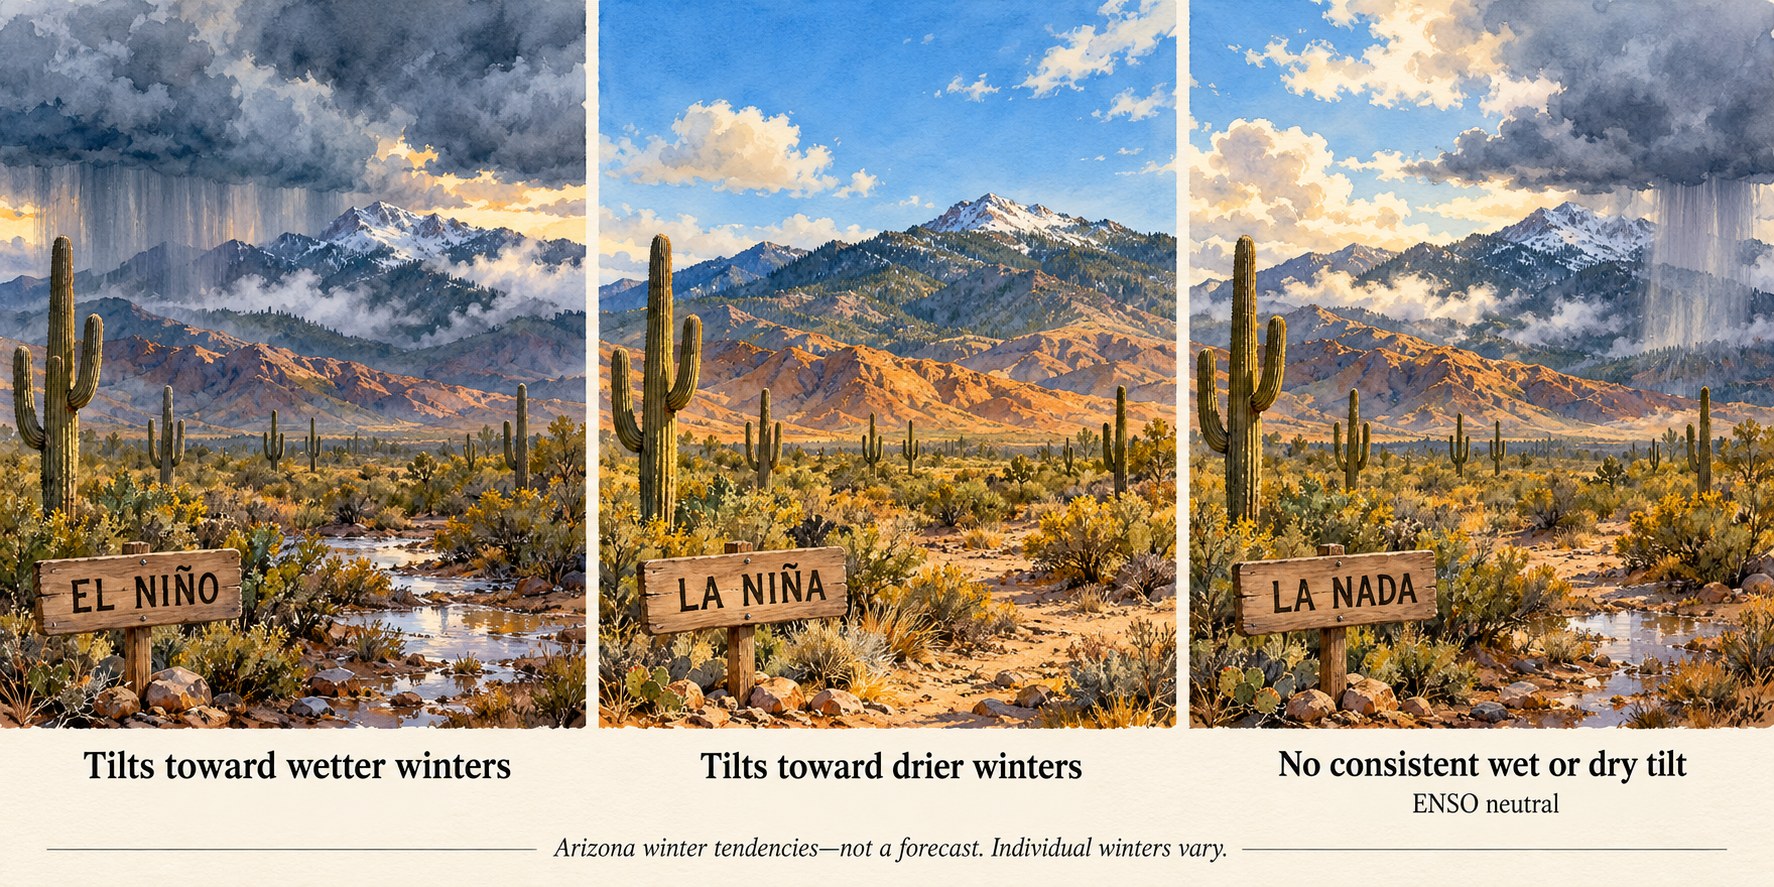
The El Niño-Southern Oscillation (ENSO) is a natural, recurring swing in ocean temperatures, rainfall, air pressure, and winds across the tropical Pacific Ocean (NOAA Climate Prediction Center, ENSO FAQ). It has three phases. El Niño is the warm phase, when the ocean surface in the central and eastern tropical Pacific runs warmer than normal. La Niña is the cool phase, when that same stretch of ocean runs cooler than normal. ENSO-neutral is everything in between. ENSO happens thousands of miles away, but it changes the path of the jet stream over North America. That shifts the odds of a wet or dry winter across the Southwest United States (NOAA Climate.gov, 2011). It shifts the odds only. A La Niña winter can still turn out wet, and an El Niño winter can still turn out dry.
How ENSO works
The “El Niño” half of the name is older than the science. Fishermen in South America saw their coastal waters turn warm from time to time, usually near Christmas. They named the warm spells “El Niño” (Spanish for a boy child), after the holiday (NOAA Climate.gov, 2014a). The “Southern Oscillation” half refers to a seesaw in air pressure between the western and eastern tropical Pacific that goes along with those ocean changes. One standard measure of it is the Southern Oscillation Index (SOI). The SOI compares surface air pressure at Tahiti, in French Polynesia, with pressure at Darwin, Australia (NOAA Climate Prediction Center, ENSO FAQ).
Along the equator in the Pacific, the trade winds normally blow from east to west. During El Niño, these trade winds weaken over the eastern half of the equatorial Pacific. The heavy tropical rainfall that normally sits over Indonesia and the western Pacific shifts east. Below the surface, the thermocline sinks deeper than usual in the east-central Pacific. The thermocline is the depth where warm surface water gives way to much colder water below. Sea surface temperatures there typically run about 1.5 to 2.5 °C (roughly 3 to 4.5 °F) above average (NOAA Climate Prediction Center, ENSO FAQ).
La Niña is roughly the reverse. The trade winds are stronger than average across the whole equatorial Pacific, and rainfall increases over Indonesia. The thermocline is shallower than usual. Sea surface temperatures typically run about 1 to 2 °C (roughly 2 to 3.5 °F) below average (NOAA Climate Prediction Center, ENSO FAQ).
El Niño and La Niña episodes typically occur every 3 to 5 years, though the gap has ranged from 2 to 7 years. An El Niño usually runs 9 to 12 months. A La Niña can hang on for 1 to 3 years. Both tend to be strongest from December through April (NOAA Climate Prediction Center, ENSO FAQ).
No two events are identical. Scientists sometimes sort El Niño events into “flavors” based on where the warmest water sits. An eastern Pacific El Niño, also called a canonical or cold-tongue El Niño, peaks near South America. A central Pacific El Niño, also called a Modoki, warm-pool, or dateline El Niño, peaks farther west, near the International Date Line. NOAA’s ENSO blog says these may be points on a continuum rather than two separate types. It also says there is “some evidence” they lead to different weather impacts around the globe (NOAA Climate.gov, 2014b).
How NOAA measures ENSO
Since February 1, 2026, NOAA’s official ENSO index has been the Relative Oceanic Niño Index (RONI) (National Weather Service, PNS 26-05). RONI starts with a box of ocean called Niño 3.4. The box spans the equatorial Pacific from 5° north to 5° south and from 170° west to 120° west (NOAA Climate Prediction Center, ENSO FAQ). RONI takes the sea surface temperature departure from normal in that box. It then subtracts the average departure across the whole tropical ocean belt, from 20° north to 20° south. Finally, it rescales the result so its swings are the same size as the older index’s. RONI is a three-month running average of that value. An El Niño is defined as RONI above +0.5 °C for five or more overlapping three-month periods in a row. A La Niña is the same, but below -0.5 °C (National Weather Service, PNS 26-05; NOAA Climate Prediction Center, RONI).
RONI replaced the Oceanic Niño Index (ONI), which measured Niño 3.4 against a 30-year average. Because the tropical oceans keep changing, a 30-year baseline can fall out of date. Measuring Niño 3.4 against the rest of the tropics at the same time avoids most of that problem (NOAA Climate Prediction Center, RONI). The switch changed how some past years are classified. Three winters that ONI had counted as weak El Niños (1958-59, 2014-15, and 2019-20) dropped off the list. One winter, 1992-93, joined it as a weak El Niño (NOAA Climate Prediction Center, RONI). Under ONI, 2020 to 2023 counted as three separate La Niña winters. Under RONI, it is one continuous three-year La Niña. It was a very dry stretch for the Southwest and the Southern Plains (Drought.gov, 2026). NOAA still updates the older ONI for anyone who needs an unbroken record (National Weather Service, PNS 26-05).
ENSO and Southwest winters
ENSO reaches the Southwest mainly through the jet stream, the band of strong winds high in the atmosphere that steers storms. During El Niño, the Pacific jet stream strengthens and runs from west to east across the southern United States. It steers more winter storms toward the Southwest. La Niña weakens the jet over the eastern Pacific and lets it drift north. Storms then tend to track into the Pacific Northwest, and the Southwest misses out (NOAA Climate Prediction Center, ENSO FAQ; NOAA Climate.gov, 2011).
The University of Arizona’s Climate Assessment for the Southwest (CLIMAS) describes the same pattern. El Niño can mean more storms and a wetter than normal winter and early spring in the Southwest. La Niña often means a drier one. But “El Niño does not guarantee a wet winter, just as La Niña does not consistently deliver dry conditions” (CLIMAS, ENSO).
Numbers show how large that tilt is. There were 21 La Niña events from 1951 to 2020. In 13 of them, the Southwest was drier than average in December and January. In the other 8, it was not (NOAA Climate.gov, 2023). The early winter of 2022-23 was one of the exceptions. It came during a La Niña, yet Southwest precipitation ran 65% above normal. Only one La Niña early winter since 1951 had been wetter. A run of nine atmospheric rivers delivered more than a season’s worth of rain and snow between late December and mid-January. Atmospheric rivers are long, narrow plumes of moisture flowing in from the Pacific. The blog post’s author, Nat Johnson, ran climate model experiments on that winter. Johnson concluded that chaotic, day-to-day weather mattered about 14 times more for Southwest precipitation than differences in La Niña’s strength or flavor (NOAA Climate.gov, 2023).
ENSO also played a part in the severe Southwest drought of 2020 and 2021. Most of the extreme dryness from fall 2020 through spring 2021 came from La Niña plus natural swings in the atmosphere. Over the long run, though, ENSO accounts for just part of how much Southwest winters vary from one year to the next (NOAA Climate.gov, 2024).
The National Weather Service office in Flagstaff describes the pattern for northern Arizona. In El Niño winters, stormy spells tend to last longer and the dry gaps between them are shorter and rarer. La Niña winters tend to run the other way (NWS Flagstaff). The office also gives average figures for Flagstaff. El Niño years averaged 15.88 inches of precipitation and 107.3 inches of snowfall. La Niña years averaged 5.94 inches of precipitation and 58.1 inches of snowfall. The page says the El Niño figures cover 1971 to 2000 (NWS Flagstaff). It does not say which months the totals cover, which station recorded them, or which years were counted. They are best read as a rough illustration, not a precise statistic.
Sources disagree about temperature. NWS Flagstaff describes El Niño winters in northern Arizona as typically wetter and warmer than usual, and La Niña winters as drier and cooler (NWS Flagstaff). NOAA Climate.gov says the reverse for temperature. It links El Niño with cooler, wetter Southwest winters and La Niña with drier, warmer ones (NOAA Climate.gov, 2024). Both agree on precipitation: wetter with El Niño, drier with La Niña.
How the PDO and AMO shape ENSO’s effect
ENSO does not act alone. Two slower ocean patterns can change how strongly its signal shows up in Southwest precipitation. The Pacific Decadal Oscillation (PDO) tracks long-lasting changes in sea surface temperatures across the North Pacific, north of 20° north. The Atlantic Multidecadal Oscillation (AMO) tracks sea surface temperatures across the North Atlantic, from the equator to 70° north. The AMO is smoothed over ten-year windows so that only the slow changes remain. Both patterns matter on time scales of a decade or more (McCabe et al., 2008).
ENSO’s pull on Western precipitation has not been steady. A U.S. Geological Survey study looked at 84 climate divisions in the western United States. It found the link between ENSO and October-March precipitation was much weaker from 1920 to 1950 than in later decades. The authors tied those swings partly to the PDO. ENSO’s link was strong when the PDO was negative, together with a particular pattern in ENSO’s own air-pressure and ocean-temperature measures. It was weak when the PDO was positive. The authors concluded that these slower ocean patterns help show when ENSO can be relied on to predict winter precipitation (McCabe and Dettinger, 1999).
The Atlantic plays a part as well, mostly over longer periods. A 2004 study counted drought years, the driest quarter of years, in each 20-year window from 1900 to 1999 across the continental United States. The PDO and AMO together accounted for 52% of the variation in that drought frequency. A warm (positive) AMO combined with a negative PDO matched the pattern of the 1950s drought. That drought hit the Southwest, the Midwest, and the Rocky Mountains and Great Basin hardest. A warm AMO with a positive PDO tended to spare the Southwest (McCabe et al., 2004). A follow-up study found that the interaction between ENSO and the AMO explains a large part of decade-to-decade drought variation across the country (McCabe et al., 2008).
In practice, the same ENSO phase can carry more weight in some decades than in others. It depends partly on what the Pacific and Atlantic are doing over longer periods.
A newer predictor: the New Zealand Index
The New Zealand Index (NZI) is much newer than ENSO. Researchers at the University of California, Irvine first proposed it in 2018 (Mamalakis et al., 2018). It is also disputed. A 2019 study argued that a link as strong as the NZI’s can sometimes appear by chance. It also found weak support for the physical pathway behind it (Gibson et al., 2019). The original authors defended their work the same year (Mamalakis et al., 2019). The index tracks sea surface temperatures in a patch of the southwestern Pacific near New Zealand. It works in the opposite direction from ENSO. Cooler water there in late summer has tended to go with wetter Southwest winters, and warmer water with drier ones. Those late-summer readings come about three months before the November through March wet season, which is what makes the index interesting for forecasting (Mamalakis et al., 2018). See the NZI entry for more detail.
ENSO and the summer monsoon
ENSO’s hold on the Southwest is mostly a winter story. CLIMAS describes monsoon rainfall, July through September, as having “weak and inconsistent links to ENSO.” Strong, statistically meaningful ENSO links turn up often in winter but seldom in summer (CLIMAS, ENSO and Monsoon). ENSO does affect parts of the monsoon system, such as how strong the monsoon’s high-pressure ridge is and where it sets up. But other factors often overwhelm that influence. These include ocean temperatures in the Gulf of California, the Gulf of Mexico, and the North Pacific (CLIMAS, ENSO and Monsoon).
A 2025 University of Arizona study looked at five Southwest regions. It found only one statistically significant link between ENSO and monsoon rainfall. Since 1980, El Niño-like years have tended to bring drier monsoons in the Rio Grande region of central New Mexico. La Niña-like years showed no matching pattern (Woodhouse et al., 2025; CLIMAS, ENSO and Monsoon).
A disputed idea: ENSO and the solar cycle
A small line of research has proposed that ENSO keeps time with the Sun’s roughly 11-year activity cycle. Its main proponents are Robert Leamon, Scott McIntosh, and Daniel Marsh. They do not measure the solar cycle by counting sunspots. Instead, they use an event they call the “terminator.” This is the point when the last of the previous cycle’s magnetic field cancels out at the Sun’s equator. They date terminators mainly from satellite images of small bright points in the Sun’s outer atmosphere. Sudden jumps in the Sun’s X-ray and radio output, and in the cosmic rays reaching Earth, back up those dates (Leamon et al., 2021).
The group looked at the five solar cycles from the 1960s to 2020. Major swings from El Niño to La Niña tended to follow terminators. In three of the five cycles, a second El Niño peak came “a couple of years after sunspot maximum” (Leamon et al., 2021). Based on the pattern, they predicted a switch to La Niña in mid-2020 (Leamon et al., 2021). A La Niña did develop that summer (NOAA Climate.gov, 2024).
The idea remains contested. The 2021 paper states that correlation does not imply causation, and it leaves the physical mechanism as an open question. The paper also shifted its terminator dates by up to 100 days to line up with changes in cosmic rays. It notes that without that adjustment, one of its three statistical tests no longer ruled out chance (Leamon et al., 2021). A later update placed the terminator that ended the previous solar cycle in December 2021. That was after the 2020 La Niña had already begun (Leamon, 2023). A separate 2026 study compared monthly sunspot numbers with the Niño 3.4 index and the SOI from 1950 to 2023. It found “no statistically significant linear or nonlinear correlations” (Man et al., 2026). That study does not test the terminator claim directly, though, since Leamon’s group times the solar cycle from terminators rather than sunspot counts.
ENSO on this site
The Sky Islands Climate Seasonal Outlook tool uses ENSO along with the PDO and AMO. It finds past years with a similar mix of ocean conditions and shows what Flagstaff’s precipitation did in those years. For ENSO, it uses a relative Niño 3.4 value in the same spirit as RONI, with the tropical-average trend removed. Its classification is simpler and experimental: a three-month average, a ±0.4 °C threshold, and no persistence requirement. From October through March, the tool also shows the latest July-September sea surface temperature in the NZI region. Warm readings point toward a drier winter, and cool readings toward a wetter one. The tool does not use the NZI to pick past years, though. It is an analog explorer, not a calibrated forecast. See the tool’s methodology notes for details (Sky Islands Climate, Seasonal Outlook).
Sources
NOAA Climate Prediction Center. “Frequently Asked Questions about El Niño and La Niña.” https://www.cpc.ncep.noaa.gov/products/analysis_monitoring/ensostuff/ensofaq.shtml
National Weather Service Headquarters. “Public Information Statement 26-05” (transition to the Relative Oceanic Niño Index, effective February 1, 2026), issued January 13, 2026. https://weather.gov/media/notification/pdf_2026/pns26-05_Relative_ONI.pdf
NOAA Climate Prediction Center. “Relative Oceanic Niño Index (RONI)” information sheet, May 2026. https://www.cpc.ncep.noaa.gov/products/analysis_monitoring/enso/roni/pdf/roni-info-may-2026.pdf
Lisonbee, J. “New NOAA El Niño-Southern Oscillation Index Supports Drought Early Warning.” Drought.gov, March 11, 2026. https://www.drought.gov/news/new-noaa-el-nino-southern-oscillation-index-supports-drought-early-warning-2026-03-11
L’Heureux, M. “What is the El Niño-Southern Oscillation (ENSO) in a nutshell?” NOAA Climate.gov ENSO Blog, May 5, 2014. https://www.climate.gov/news-features/blogs/enso/what-el-ni%C3%B1o%E2%80%93southern-oscillation-enso-nutshell
L’Heureux, M. “ENSO Flavor of the Month.” NOAA Climate.gov ENSO Blog, October 16, 2014. https://www.climate.gov/news-features/blogs/enso/enso-flavor-month
Lindsey, R. “Influence of El Niño and La Niña on Southwest Rainfall.” NOAA Climate.gov, February 11, 2011. https://www.climate.gov/news-features/event-tracker/influence-el-ni%C3%B1o-and-la-ni%C3%B1a-southwest-rainfall
Johnson, N. “Did La Niña drench the Southwest United States in early winter 2022/23?” NOAA Climate.gov ENSO Blog, February 23, 2023. https://www.climate.gov/news-features/blogs/enso/did-la-nina-drench-southwest-united-states-early-winter-202223
Bao, H. “ENSO and the southwest United States ‘megadrought.’” NOAA Climate.gov ENSO Blog, August 28, 2024. https://www.climate.gov/news-features/blogs/enso/enso-and-southwest-united-states-megadrought
Climate Assessment for the Southwest (CLIMAS), University of Arizona. “El Niño Southern Oscillation.” https://climas.arizona.edu/sw-climate/el-nino-southern-oscillation
Climate Assessment for the Southwest (CLIMAS), University of Arizona. “ENSO and Monsoon.” https://climas.arizona.edu/sw-climate/enso-and-monsoon
Woodhouse, C.A., Crimmins, M.A., & Meko, M.D. “The Role of Seasonal Precipitation Sequences in Shaping the Climate of the United States Southwest.” International Journal of Climatology, 45(15), e70138, 2025. https://doi.org/10.1002/joc.70138
National Weather Service Flagstaff. “La Nina, El Nino and Northern Arizona Weather.” https://www.weather.gov/fgz/Ella
McCabe, G.J., & Dettinger, M.D. “Decadal variations in the strength of ENSO teleconnections with precipitation in the western United States.” International Journal of Climatology, 19(13), 1399-1410, 1999. https://pubs.usgs.gov/publication/70021246
McCabe, G.J., Palecki, M.A., & Betancourt, J.L. “Pacific and Atlantic Ocean influences on multidecadal drought frequency in the United States.” Proceedings of the National Academy of Sciences, 101(12), 4136-4141, 2004. https://doi.org/10.1073/pnas.0306738101
McCabe, G.J., Betancourt, J.L., Gray, S.T., Palecki, M.A., & Hidalgo, H.G. “Associations of multi-decadal sea-surface temperature variability with US drought.” Quaternary International, 188(1), 31-40, 2008. https://doi.org/10.1016/j.quaint.2007.07.001
Mamalakis, A., Yu, J.-Y., Randerson, J.T., AghaKouchak, A., & Foufoula-Georgiou, E. “A new interhemispheric teleconnection increases predictability of winter precipitation in southwestern US.” Nature Communications, 9, 2332, 2018. https://doi.org/10.1038/s41467-018-04722-7
Gibson, P.B., Waliser, D.E., & DeFlorio, M.J. “A critical examination of a newly proposed interhemispheric teleconnection to Southwestern US winter precipitation.” Nature Communications, 10, 2019 (published June 19, 2019). https://doi.org/10.1038/s41467-019-10528-y
Mamalakis, A., Yu, J.-Y., Randerson, J.T., AghaKouchak, A., & Foufoula-Georgiou, E. “Reply to: A critical examination of a newly proposed interhemispheric teleconnection to Southwestern US winter precipitation.” Nature Communications, 10, 2019 (published June 27, 2019). https://doi.org/10.1038/s41467-019-10531-3
Leamon, R.J., McIntosh, S.W., & Marsh, D.R. “Termination of Solar Cycles and Correlated Tropospheric Variability.” Earth and Space Science, 8, e2020EA001223, 2021. https://doi.org/10.1029/2020EA001223
Leamon, R.J. “The triple-dip La Niña of 2020-22: updates to the correlation of ENSO with the termination of solar cycles.” Frontiers in Earth Science, 11, 1204191, 2023. https://doi.org/10.3389/feart.2023.1204191
Man, Y., Gao, C., Chao, B.F., Li, Z., & Zhang, Z. “Correlation analysis between sunspot activity and ENSO.” Geodesy and Geodynamics, 2026 (in press; accepted July 1, 2026). https://www.sciencedirect.com/science/article/pii/S1674984726001011